Vertical Divider
|
Will the iPhone X and Derivatives Usher in a New “Super Cycle”
June 11, 2018 Even as iPhone X sales disappointed analysts and Apple’s iPhone March quarter sales increased by just 3% Y/Y,upgrades to Apples new iPhone lineup are expected to shatter all records. But it’s not just the steep price tag for the iPhone X that has kept a lid on iPhone sales; it’s a combination of several factors.
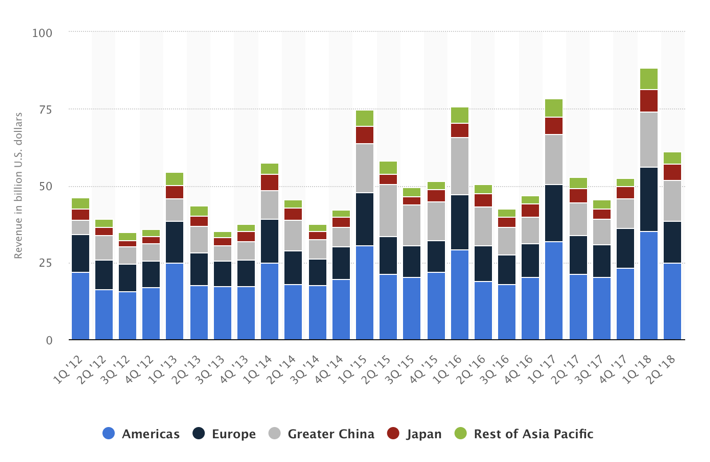
Over the years, consumers have become conditioned to accept high sticker prices when it comes to quality smartphones. The original iPhone was priced at $499 for the 4 GB phone and the 8 GB model was $599 when the device first debuted. Before that, such prices were largely unheard of in the cellphone market, yet the device became a wild success. Since then, consumers have gradually become accustomed to paying more and more for smartphones on a perpetual basis. However, the price elasticity of demand proved to no longer be unlimited and many potential buyer balked at the >US$1,000 price tag. However, consumers rarely pay 100% out of pocket for their phones in developed markets. Most U.S. consumers purchase their phones with a 30-month or a 24-month interest-free contract. Therefore, comparing the difference in price given these metrics, the iPhone X costs consumers an additional $10 per month in relation to the iPhone 8 and just an extra $6.67 a month in relation to the iPhone 8 Plus. One of the keys to analyzing Apple’s intentions is the profitability of the iPhone X. It costs the company $370 to build the base $999 version of the device, which indicates that Apple makes 63% gross margin on the base model, and presumably the gross margin is even better for higher-end, more expensive versions of the device. The iPhone X generates a gross profit of at least $629 per model X device, which is much higher than the gross margin Apple receives for the iPhone 8 Plus ($457) and the 8 ($407.40). Figure 1: iPhone Revenue by Quarter and Region Source: Company
IPhone Revenue Growth by Key Regions H1 2017 Vs. H1 2018 Americas: H1 2017 - $53.13 billion, H1 2018 - $60.03 billion, YoY revenue growth = 13% Europe: H1 2017 - $31.25 billion, H1 2018 - $34.9 billion, YoY revenue growth = 12% Greater China: H1 2017 - $26.96 billion, H1 2018 - $30.98 billion, YoY revenue growth = 15% Japan: H1 2017 - $10.26 billion, H1 2018 - $12.71 billion, YoY revenue growth = 24% Rest of Asia Pacific: H1 2017 - $9.66 billion, H1 2018 - $10.81 billion, YoY revenue growth = 12% Some analysts are projecting double-digit revenue growth in all areas Y/Y. Moreover, the introduction of new “pricey” iPhone variations suggests that this trend is likely to accelerate going forward and Apple should easily beat consensus estimates. As Apple Inc. looks set to make more iPhones using organic light-emitting diode displays; one of its key screen suppliers expects revenue will remain driven by older technology. |
|
|
Contact Us
|
Barry Young
|

