Vertical Divider
|
UDC Reports Q218 Revenue of $118m and Net Income of $43m, up 110% and 302%, Respectively
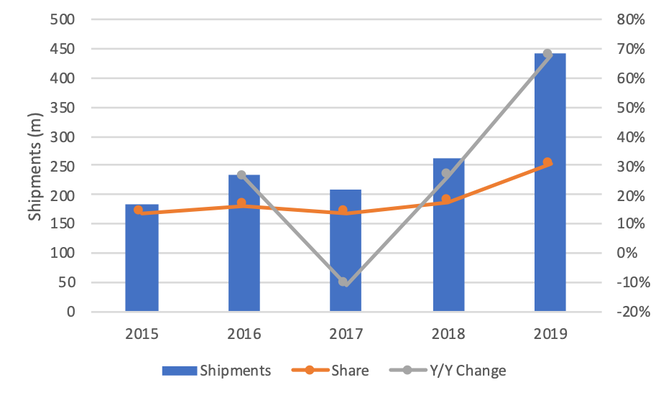
August 05, 2019 UDC reported another strong quarter on Q219, with revenues under ASC 606 of $118.2 million, operating profit of $48.7 million and net income of $43.4 million. is Approximately $15 million to $20 million of orders were pulled-in from the second-half of the year from Chinese customers due to what is believed to be trade-related reasons. The 2019 outlook for revenue under ASC 606 was in the range of $370 million to $390 million. What is remarkable is the rapid development of China’s OLED adoption both from a smartphone perspective and from a panel makers viewpoint. Since 2017, the OLED percentage of smartphone shipments has grown from 13.7% to a projected 30.6% with units increasing from 208m to a projected 441m. Figure 1: OLED Smartphone Shipments and Share |
|
Source: SCMR, LLC
What is remarkable is the rapid development of China’s OLED adoption both from a smartphone perspective and from a panel makers viewpoint. Since 2017, the OLED percentage of smartphone shipments has grown from 13.7% to a projected 30.6% with units increasing from 208m to a projected 441m.
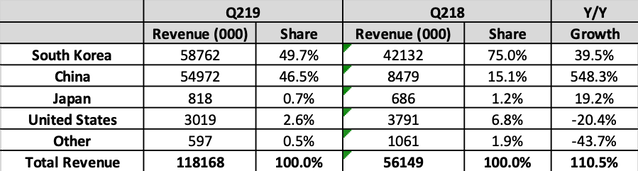
The growth from China was reflected in UDC’s financials as China’s share of material revenue grew from 15.1% in Q118 to 46.5% in Q219. Since UDC breaks out its dependence on large customers, labeling them A (Samsung), B (LGD)and C (BOE),the Q219 material revenue growth was more a function of UDC’s Chinese customers other than BOE, which was up only 15.2%, while all of China was up >500%.
Table 1: UDC’ Revenue by Country
Source: Company
Table 2: UDC’ Revenue from Leading Customers
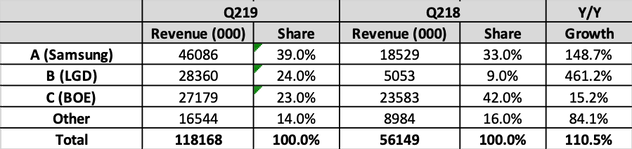
Source: Company Reports
Company ID. added by OLED-A
As shown in the next figure, UDC’s quarterly Y/Y revenue growth averaged 72% over the last 12 months and should continue as OLEDs take a greater share of smartphone shipments and LG doubles its capacity for TV panels.
Figure 2: UDC Emitter. Material Revenue by Color (Excluding Host Sales)

Source: Company Reports