Vertical Divider
Smartphones
Q220 OLED Panel Shipments Drop Faster than Smartphone Shipments 23% vs.16%
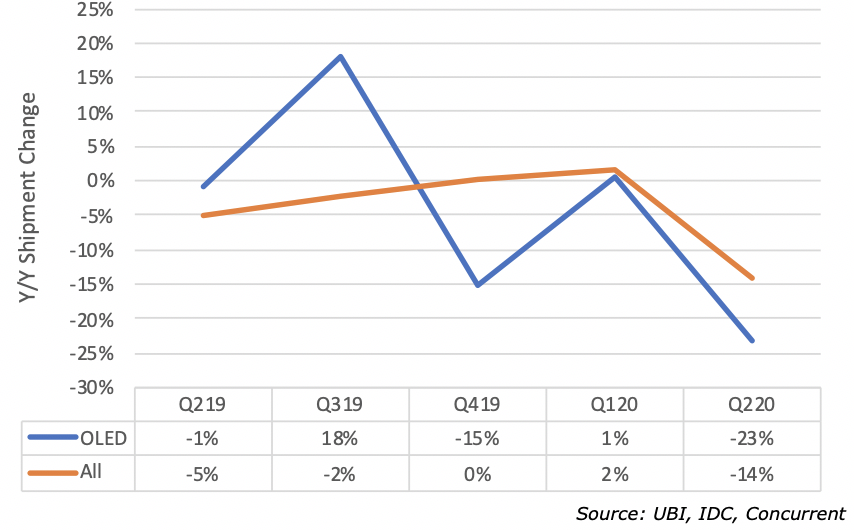
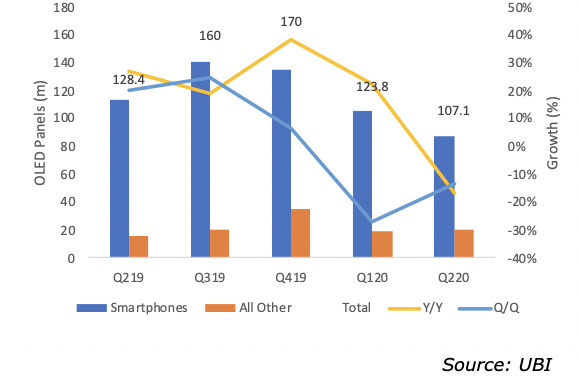
Global smartphone shipments were down 15.5% Y/Y but up 20.2% sequentially. Huawei on the strength of its support by Chinese people passed Samsung in shipments to become #1 as its share in China was 46% up from 35% in Q219. The drop in all smartphone shipments was also reflected in OLED smartphone shipments, which were down 24% Y/Y driven by rigid panels, which were down 39%, even as flexible OLEDs were up 38% Y/Y. Over the past 5 quarters, Y/Y OLED panel growth has been mixed when compared with total smartphone growth. These results pose a serious question as to whether OLED panel shipments can increase their market share as all the researchers predict after the effects of Covid -19 end.
Figure 1: OLED Panel Growth vs. Smartphone Shipment Growth
Q220 OLED Panel Shipments Drop Faster than Smartphone Shipments 23% vs.16%
Global smartphone shipments were down 15.5% Y/Y but up 20.2% sequentially. Huawei on the strength of its support by Chinese people passed Samsung in shipments to become #1 as its share in China was 46% up from 35% in Q219. The drop in all smartphone shipments was also reflected in OLED smartphone shipments, which were down 24% Y/Y driven by rigid panels, which were down 39%, even as flexible OLEDs were up 38% Y/Y. Over the past 5 quarters, Y/Y OLED panel growth has been mixed when compared with total smartphone growth. These results pose a serious question as to whether OLED panel shipments can increase their market share as all the researchers predict after the effects of Covid -19 end.
Figure 1: OLED Panel Growth vs. Smartphone Shipment Growth
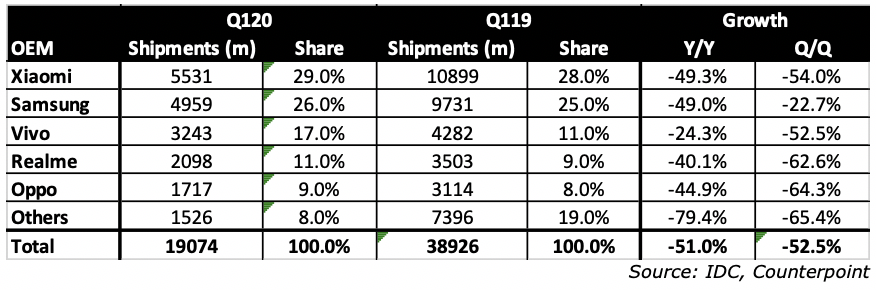
The next tables show the Q220 smartphone shipments for the industry, China, US and India. All regions were down Y/Y, but India suffered the most loss with a 51% Y/Y drop in shipments.
Table 1: Q220 Global Smartphone Shipments, Share, Growth
Table 1: Q220 Global Smartphone Shipments, Share, Growth
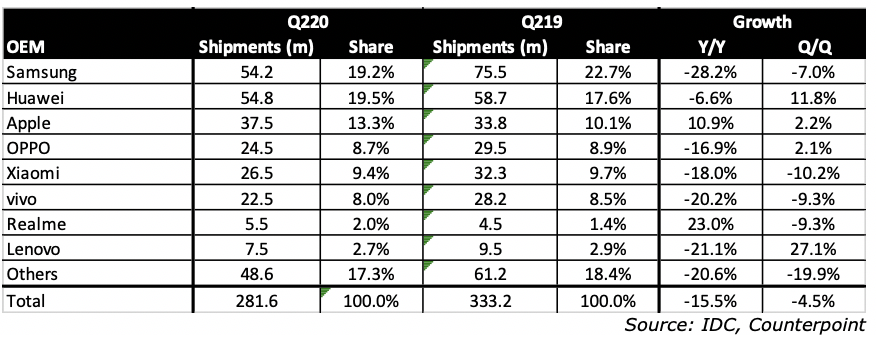
Table 2: Q220 China Smartphone Shipments, Share, Growth
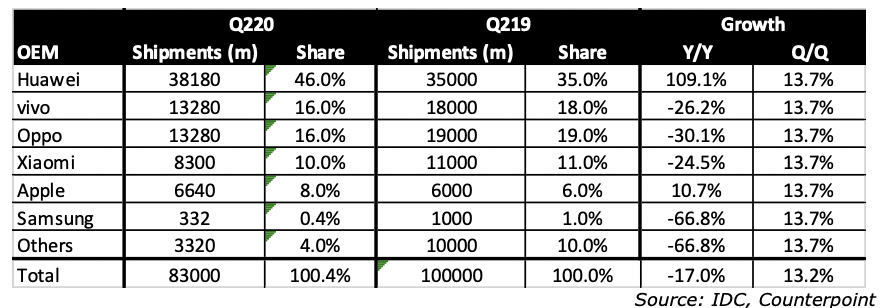
Table 3: Q220 North America Smartphone Shipments, Share, Growth
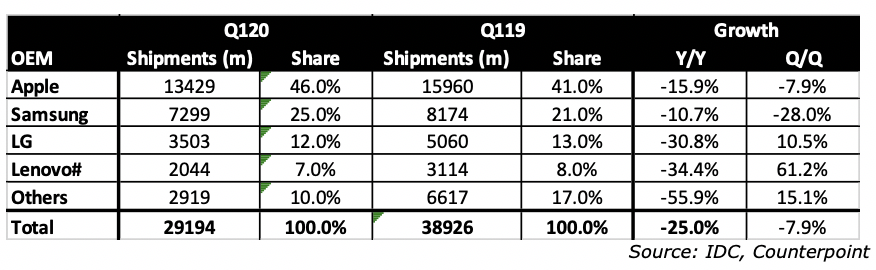
Table 4: Q220 India Smartphone Shipments, Share, Growth
Strategy Analytics (SA) reported that Samsung Electronics, 2nd in shipments was third in Q220 market share based on smartphone revenue. Apple retained its #1 position. Huawei, which was #2 in smartphones shipped in Q220 was 2ndin revenue This is the first time Samsung Electronics, which has been competing Apple for the first place, placed below second place since the second quarter of 2011. Samsung Electronics’ revenue in the second quarter was around $13 billion down 26% Y/Y. The Galaxy S20, did not meet Samsung Electronics’ sales expectations. The largest percentage of the company’s revenue came from its entry models as mid-range and low-end smartphones were the most popular models throughout the global market. Although it was able to maintain its profitability with its cost reduction efforts, it could not keep its revenue from falling due to a 27.4% drop in shipments. China buyers supported Huawei in reaction to the U.S. Government’s sanctions also helped raised Huawei’s market share.
Figure 2: Q220 Smartphone OEM’s Revenue Share
Figure 2: Q220 Smartphone OEM’s Revenue Share
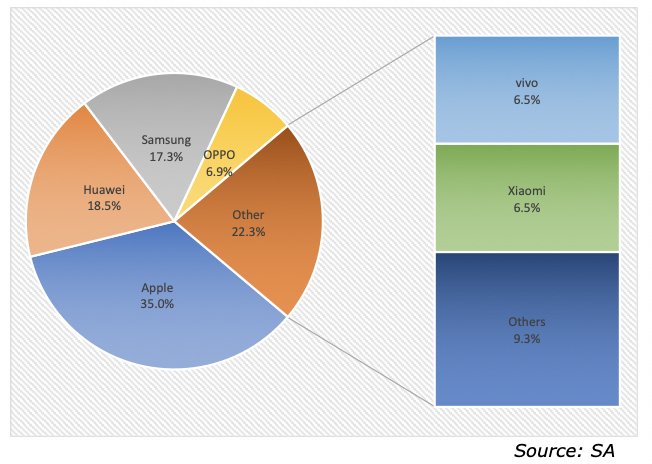
Huawei’s revenue was around $14 billion down 4% Y/Y. It was able to minimize further loss in revenue as China was able to recover from COVID-19 faster than other countries. Huawei’s smartphone shipments in the second quarter, were 54.1 mi units. It was able to absorb a significant part of demands for 5G conversion within the Chinese market by introducing many new products that support 5G. The ranking is likely to be a single event, given the additional restrictions imposed by the U.S. Government. Apple had revenue of $26 billion, a small increase Y/Y. Although its retail sales and production were down early in the quarter, the introduction of the popular iPhone SE helped overcome the slow start. Average smartphone prices for the three leaders were:
OLED panel shipments in Q220 were 87 million down 23.1% Y/Y and 17% sequentially. Shipments of rigid OLED panels were down 40.3% Y/Y, while flexible OLED panel were up 38% Y/Y.
Figure3 : Rigid vs. Flexible OLED Shipments and Overall Growth
- Apple $677
- Huawei $259
- Samsung $237
OLED panel shipments in Q220 were 87 million down 23.1% Y/Y and 17% sequentially. Shipments of rigid OLED panels were down 40.3% Y/Y, while flexible OLED panel were up 38% Y/Y.
Figure3 : Rigid vs. Flexible OLED Shipments and Overall Growth
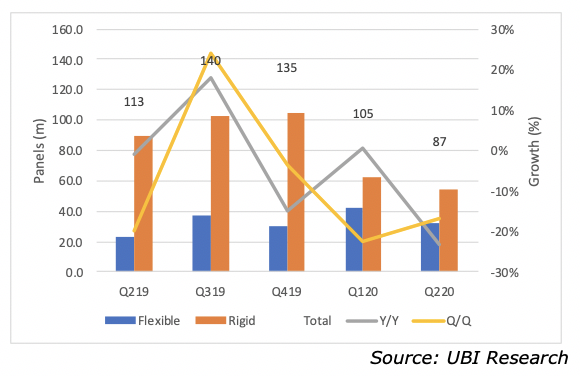
The drop in rigid OLED panel shipment was caused by Chinese smartphone makers producing less mid-tier smartphones during the quarter, as they focused on flagship smartphones however, which helped shipment of flexible OLED panels grow.
Shipments of all OLED panels, which includes those for TVs and PCs, stood at 170 million units during the second quarter down 16.6% Y/Y and down 13.4% sequentially
Figure 4: OLED Panel Shipments and Overall Growth, Smartphones and Others
Shipments of all OLED panels, which includes those for TVs and PCs, stood at 170 million units during the second quarter down 16.6% Y/Y and down 13.4% sequentially
Figure 4: OLED Panel Shipments and Overall Growth, Smartphones and Others
The COVID-19 pandemic that effected all end-product sales was the cause, the research firm said. The major Chinese OEMs used OLED panels for their flagship smartphone models. Chine flexible panel makers offer their panels at 60% of the price the Samsung Display price, even as Chinese panel maker have ~1/2 the yield of Samsung. From: THE ELEC, Korea Electronics Industry Media(http://thelec.net)