Vertical Divider
Musing from Display Week
DisplayWeek started on a high note as market analysts proclaimed 2021 to be a year of startling growth in both shipments and revenue. Part of the growth is a recovery from the pandemic, but there also seems to be a certain resilience that is driving renewed investment. After a 2019 capex of only $11.6B, investment was $15.3B in 2020 and is expected to accumulate to $44.3B from 2021 to 2023.
Figure 1: Display Capex and Revenue
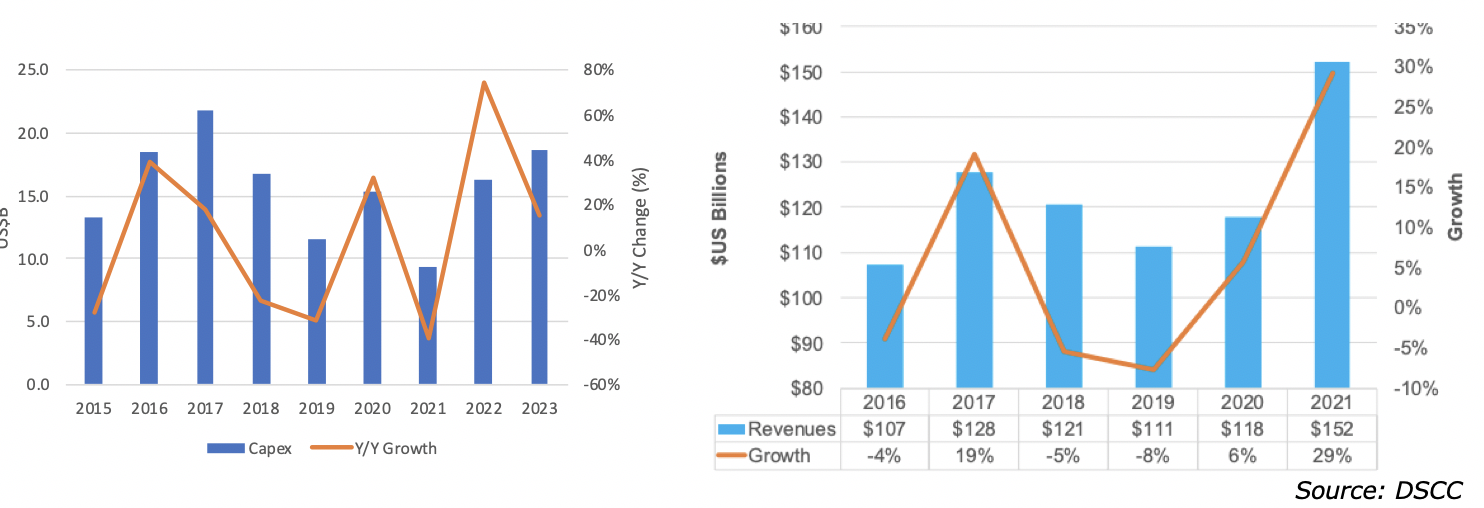
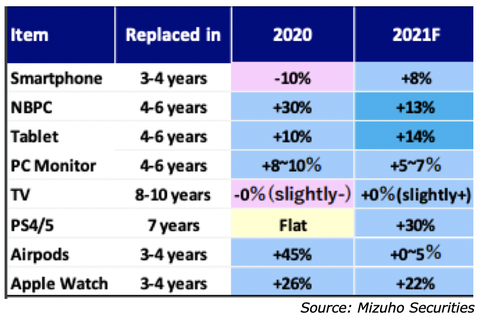
By application, the market outlook 2020 to 2021 comparison is positive as only PC monitors and Notebook PCs, which experienced strong growth in 2020, due to the WAH phenomena, AirPods and Smart Watches are expected to grow slower in 2021 than 2020. Smartphones are expected to reach 2019 levels of 1.4b in 2021 and Notebooks, PC monitors and Tablets, which had 2020 growth rates of 30%, 10% and 10% respectively are expected to flourish again in 2021. Total display revenue is forecast to grow to $150B in 2021, up 30% Y/Y, after 3 straight years of declines.
Table 1: Market Outlook by Product 2020 vs. 2021
Table 1: Market Outlook by Product 2020 vs. 2021
DSCC forecasted a surge in LCD capex in 2021, which would cut into the rapid price increases in large panels, while OLED capex is expected to peak in 2024 as new TV fabs (Gen 8.5) are installed by BOE and CSoT.
Figure 2: Display Capex by Technology
Figure 2: Display Capex by Technology
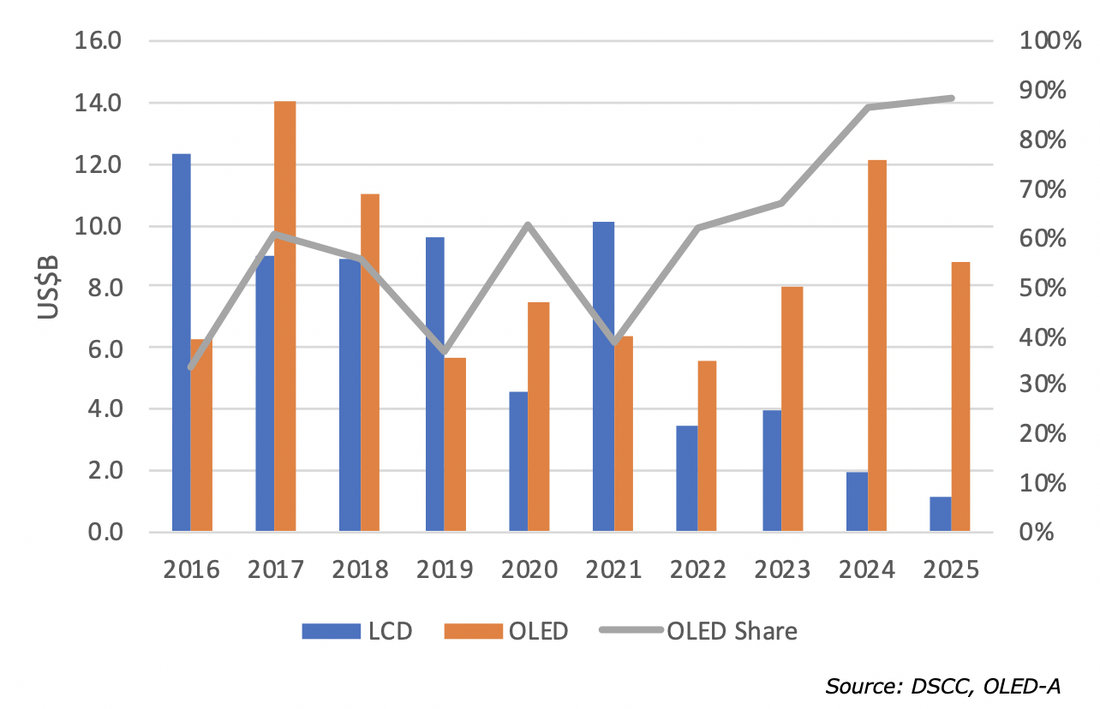
Beyond 2021, LCD capex is expected to grow in 2022 for Gen 8.5/6 fabs and then fall thereafter. OLED capex is expected to be down inn 2021, rise in 2022 and then drop slowly in 2023. Continued investment in China to meet the smartphone demand is expected in each forward years, while OLED TV panel investment is marked by CSoT and BOE in 2022 and 2023 and then LG in 2023 with their Gen 10.5.
Figure 3: Capex Trends by Fab
Figure 3: Capex Trends by Fab
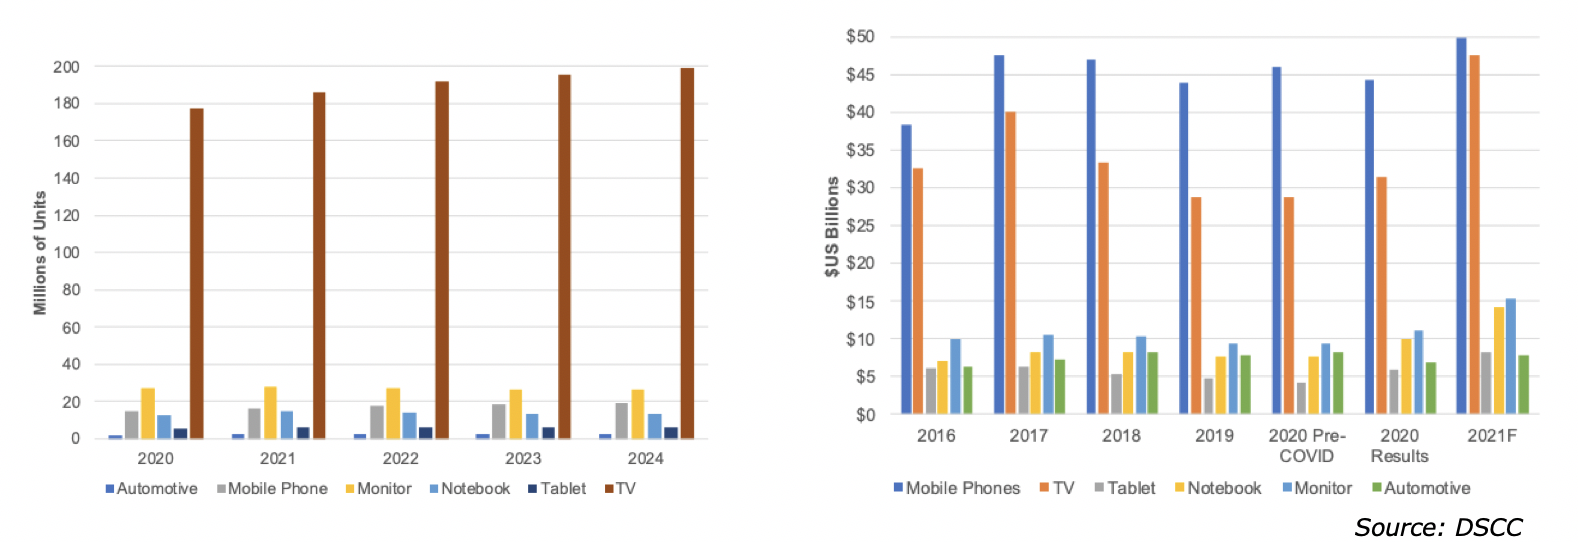
The growth in the average size of TV panels has made the application so dominant in terms of capacity utilization that it now represents over 80% of the totals m2 produced by the industry at 180m m2. By 2024, the share will increase, and the volume is expected to reach 200m m2, while the other applications will remain steady. However, it terms of 2020 panel revenue, mobile phones outpaced TVs with $45B, whereas TVs generated $31.5B. DSCC expects TV revenues to grow to $48B in 2021, driven by larger sizes and higher ASPs, while mobile phone revenues rise to $50.6B. These two categories are ~65% of total FPD revenue.
Figure 4: Display Area (m m2) and Revenue ($B)
Figure 4: Display Area (m m2) and Revenue ($B)
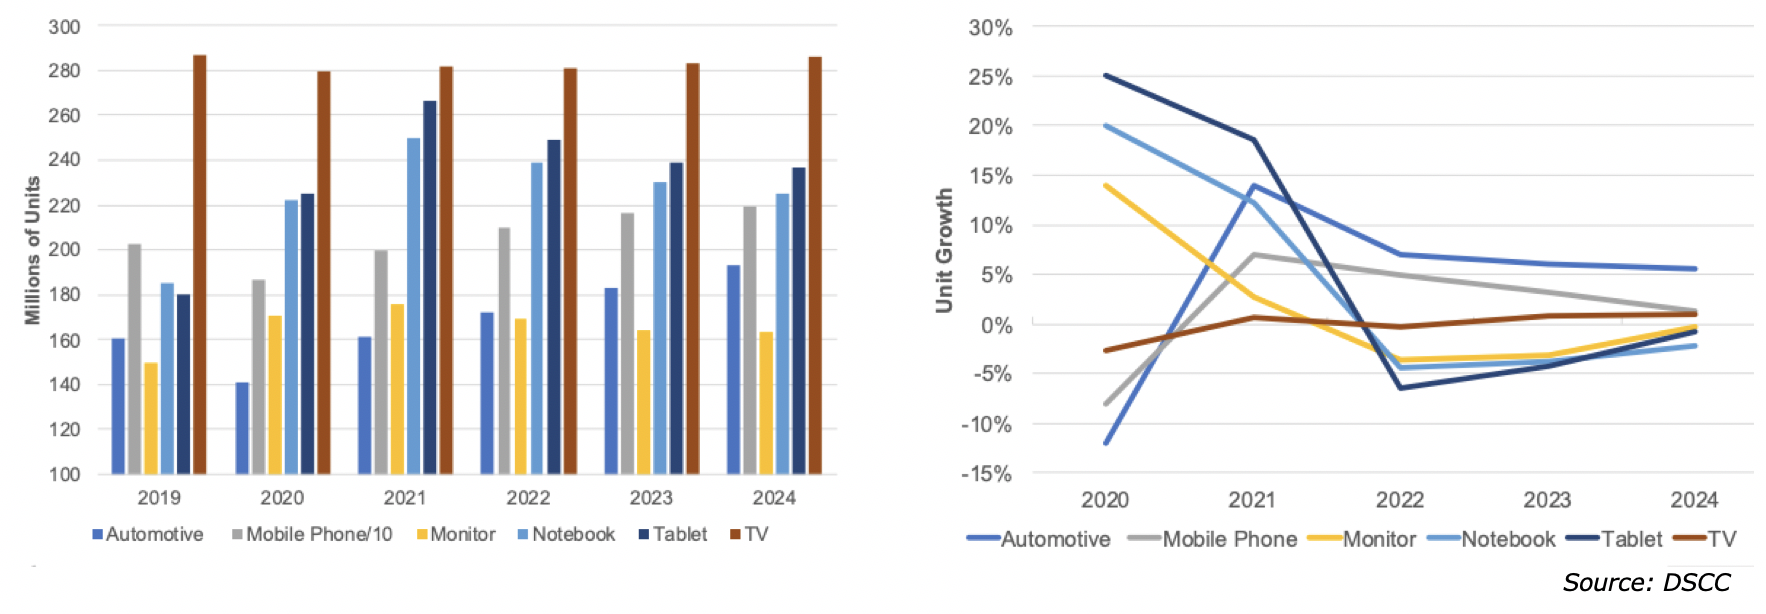
From a shipment volume perspective, the wild fluctuations of 2020 and 2021, where Y/Y growth rates by application varied from 25% for notebooks to -12% for automotive displays are expected to return to a more normal condition in 2022 to 2024, when growth will moderate between +10% and -5% depending on the application.
Figure 5: Display Shipments (m) and Growth
Figure 5: Display Shipments (m) and Growth
Notebook and tablets drove LCD demand and ASPs as they were up 30% and 10% Y/Y, respectively to 210m and 148m panels. Since notebook panel’ price/m2, is significantly higher than TVs, production was shifted to notebooks creating a scarcity in TV panels and a subsequent rise in the ASP. Notebook and Tablet shipments are expected to increase in 2021 but more modestly. Since OLED shipments are growing and TV shipments are falling slightly, OLEDs are gaining minimally in market share. Over the last 5-years, the notebook market has been very stable, with the top 5 OEMs being HP, Lenovo, Dell, Apple and ASUS. HP and Lenovo are very close so they have been swapping leadership position and Apple will gain or lose market share based on popularity oof their latest product release.
Table 2: Notebook Shipments by OEM
Table 3: Tablet Shipments by OEM
Notebook panel suppliers had 20% Y/Y gains as the notebooks and tablets surged up 30% and 10% respectively. In 2021, panel volume is forecast to be up 15% Y/Y with BOE, AUO and Innolux up double digits.
Table 4: Notebook Panel Shipments by Panel Maker
Table 4: Notebook Panel Shipments by Panel Maker

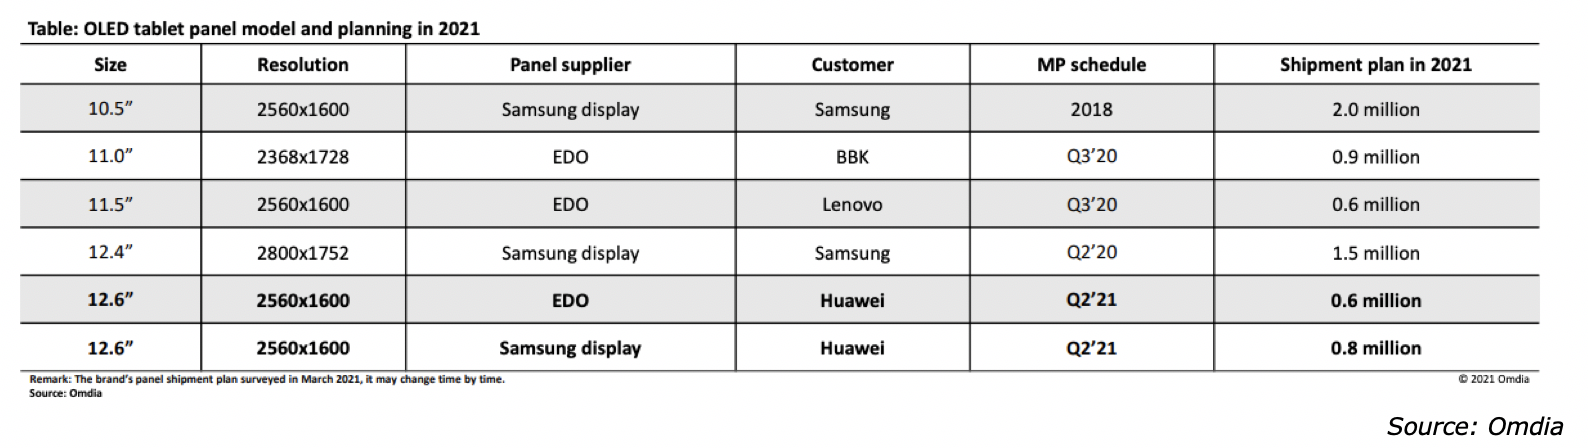
OLED panels for the category are expected to be under 5m, but with Samsung dedicating an entire line to the mid-range and the expected performance increases, 2022 could reach 10m units.
Table 5: Tablet Planning
Table 5: Tablet Planning
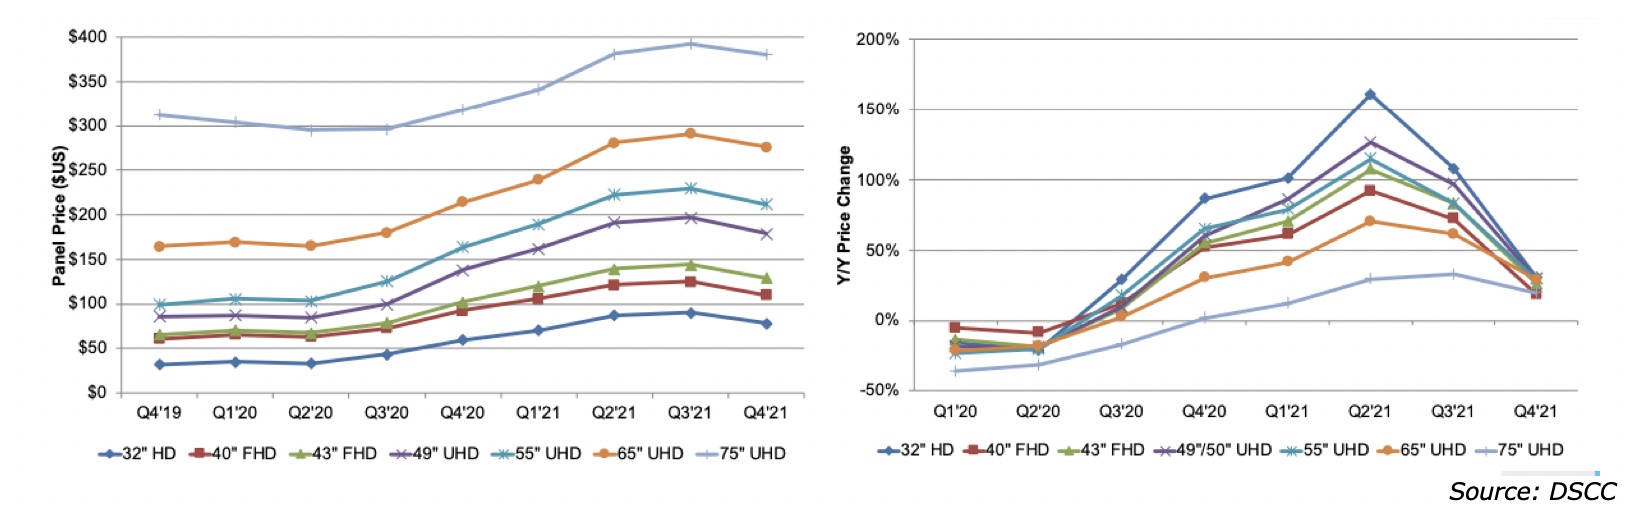
Despite the growth in TV panel area, the number of units is expected to remain flat, but the trend of rising TV panel ASPs is expected to end between Q321 and Q421 as more capacity enters the market. The past 1 ½ years have been un precedent in the industry as the typical 10% average drop Y/Y was reversed as shown in the next figure as prices rose as much as 150% Y/Y (75”). Even by Q421, DSCC doesn’t expect prices to start retreating just the Y/Y growth. The increase in TV panel prices is good news for LGD on two levels:
As OLED TV panel profit margins increase, it is likely to encourage other panel makers to speed up their OLED investments to take advantage of the higher panel prices. DSCC forecast that LCD prices will continue rising throughout 2021, although the percentage increase is expected to taper beginning in Q321.
Figure 6: LCD TV Panel ASPs by Size and Y/Y Change
- Profit margins are up because of the increased ASP for 55” and 65” OLED panel prices are close to parity when the backlight is added to the panel.
- At the high end Mini LED TVs have comparable prices to OLED TVs, which has caused LG to change their pricing strategy from consistent decreases to small increases.
As OLED TV panel profit margins increase, it is likely to encourage other panel makers to speed up their OLED investments to take advantage of the higher panel prices. DSCC forecast that LCD prices will continue rising throughout 2021, although the percentage increase is expected to taper beginning in Q321.
Figure 6: LCD TV Panel ASPs by Size and Y/Y Change
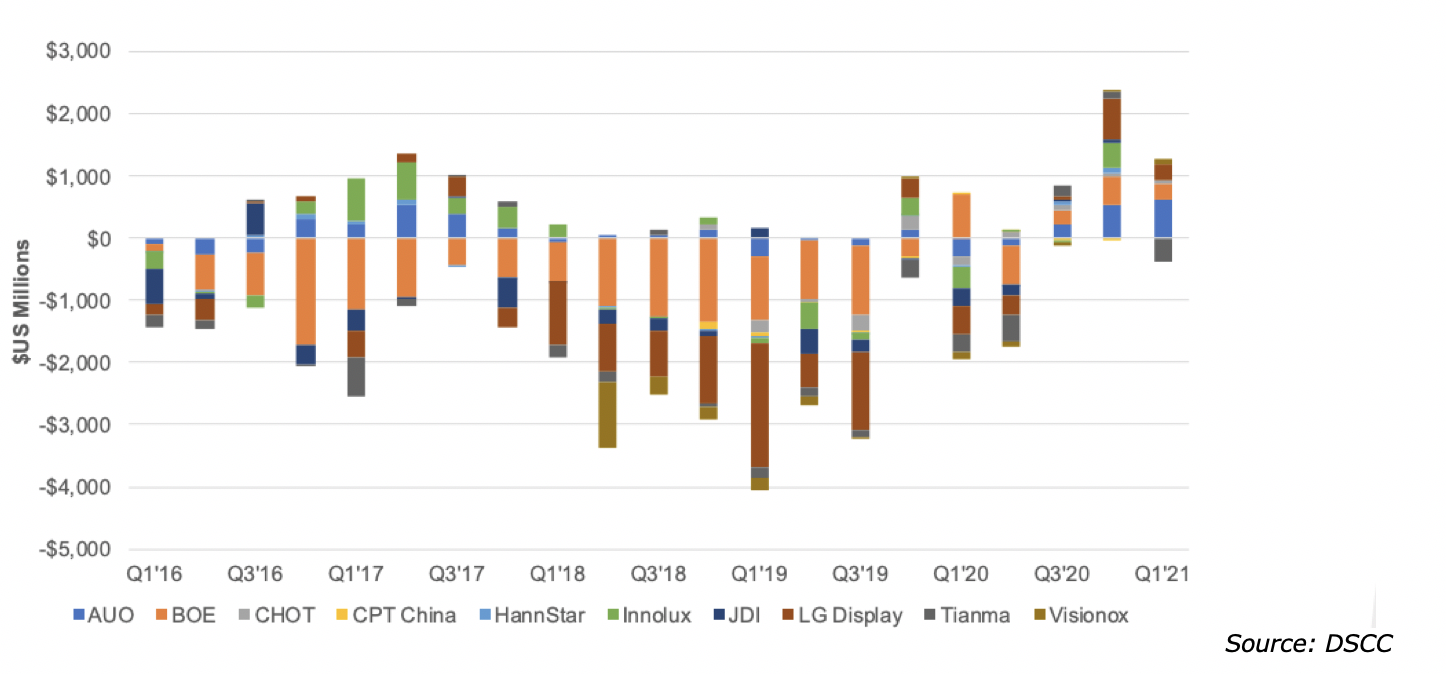
The next chart shows the free cash for all the public display companies, which was cumulatively negative for each quarter from Q116 to Q220. The free cash is actually much worse than the chart shows in that the cash infusion from the Chinese government, which accounts for 75% of the capex for Chinese fabs is not reflected in the free cash calculation. The Chinese government typically invests 75% of the capex and receives a 25% interest in the fab. The good news is that starting in Q320, the free cash has been positive maxing out in Q420 with $2.4B. Since the cost of a new OLED gen 6 fab is over $4B, individual panel makers are not able to self-fund a new fab, without resorting to the government, borrowing or accessing the market.
Figure 7: Display Companies Quarterly Free Cash by Panel Maker
Figure 7: Display Companies Quarterly Free Cash by Panel Maker
Turning to individual applications, the TV market peaked in 2018 with 223 sets and have been sliding ever since. 2020 shipments were 222m and the market is expected to remain close to that level thru 2024, when it is forecast to be 217m sets. The size make-up is changing as shown in the next set of charts.
Figure 8: TV Shipment Share by Size; 2020 vs. 2024e
Figure 8: TV Shipment Share by Size; 2020 vs. 2024e

The next table plots the history of TV shipments by size beginning in 2001, when CRTs dominated the category. PDPs had a run between 2003 and 2013,, but then faded quickly. OLED TVs started shipping in 2015 and are expected to reach ~15m units in 2024, less than 10% market share. At that point, however, OLED TV growth could accelerate with new Gen 8.5 fabs from BOE, CSoT, SDC and a Gen 10.5 fab from LGD, which cumulatively could double capacity giving OLEDs a 30% share of the lucrative 50” and greater TV market.
Table 6: TV Shipments by Technology and Size
Table 6: TV Shipments by Technology and Size

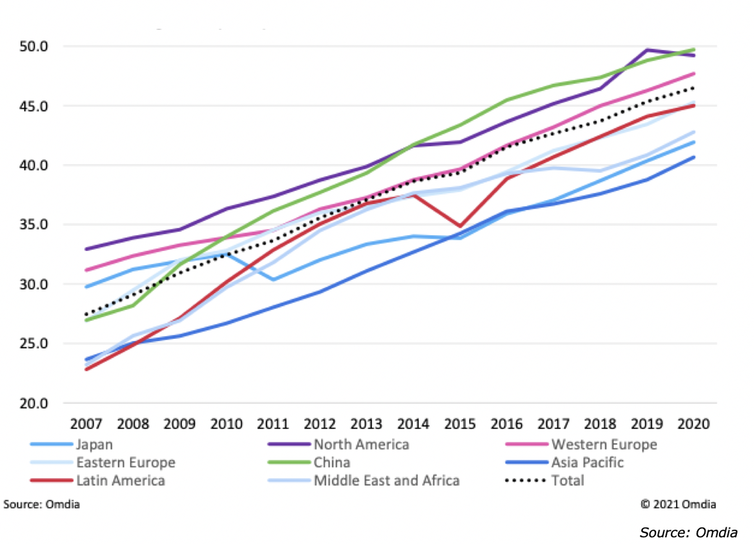
The next figures plot the growth in average TV size by region for the total TV market. The average size of all TVs has grown from ~27” in 2007 to 45” in 2020. By region the average size varies from 50” in China and North America to just over 40” in Asia Pacific.
Figure 9: Average TV Size by Region
Figure 9: Average TV Size by Region
The top 5 brands and their market shares for TV sets in 2020 and 2021 are shown in the next table. In 2021, TCL is expected replace LG as the #2 supplier.
Table 7: TV Set Share by Brand
Table 7: TV Set Share by Brand
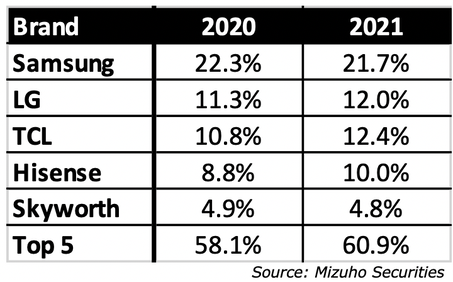
Table 8: LCD TV Shipments by Brand
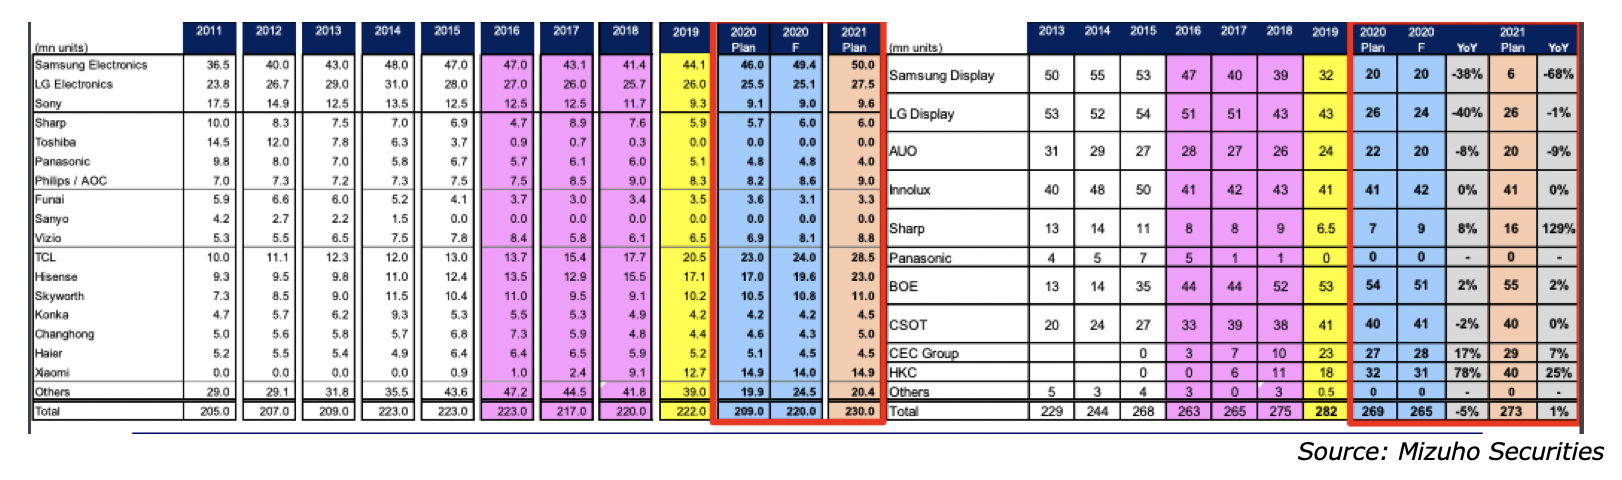
The dilemma for Samsung is that in 2020, 65% of their panels where sourced from China. In 2022, when panel prices start to return to 2019 levels, there will be pressure on SDC to close down the Gen 7 and Gen 8 fabs, putting more of the demand to China. Samsung Visual is now considering alternatives, including adopting OLEDs. They are toying with getting 2m OLED panels from LGD and then another 1-2m from SDC’s QD-OLED program.

DSCC constructed a comparison of their forecasts for large area displays using OLED and Mini LED LCD technology and showed that in 2021 OLEDs would lead Mini LEDs by 15m units to 9m units. In 2021, both technologies would share 40m units equally and after 2022 Mini LED will grow faster than OLEDs, reaching a total of 62m units in 2025, while OLEDs hit 38m. The comparison shows Mini LED LCDs growing faster than OLEDs, but in reality, OLEDs are taking share from LCDs, while Mini LEDs are simply shifting LCD demand from LED to Mini LED backlights.
Figure 10: OLED vs. Mini LED LCD Shipment Forecast
Figure 10: OLED vs. Mini LED LCD Shipment Forecast
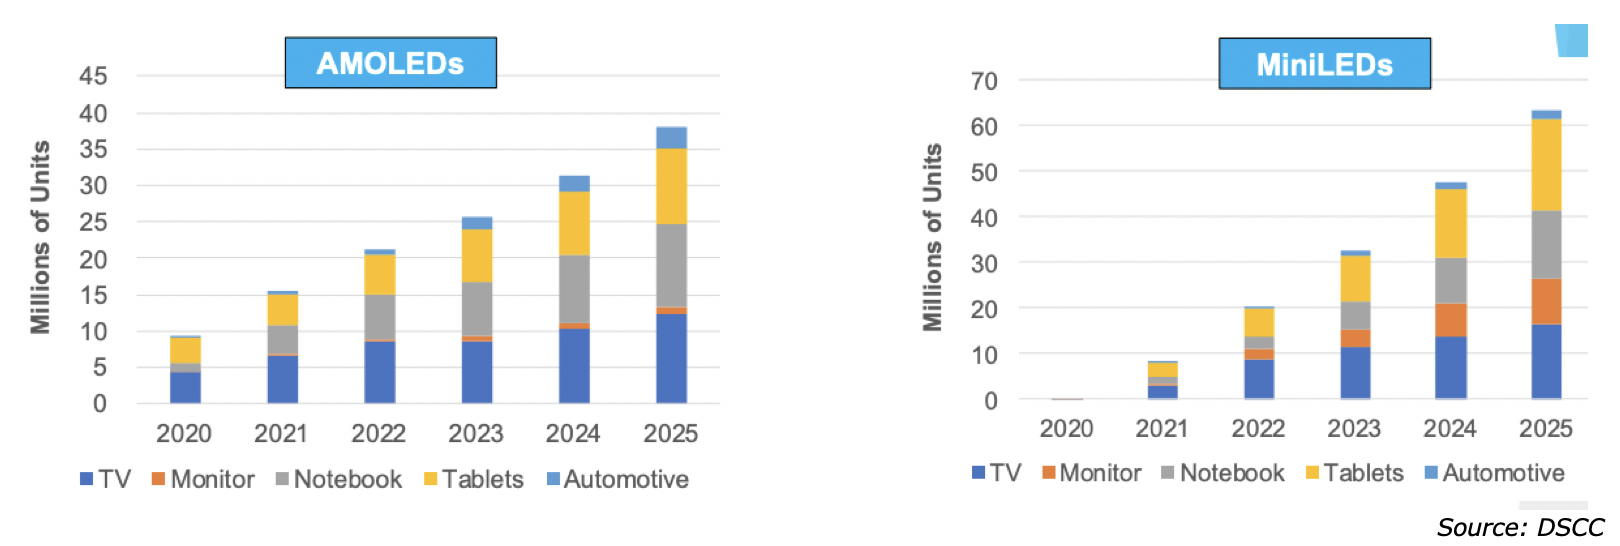
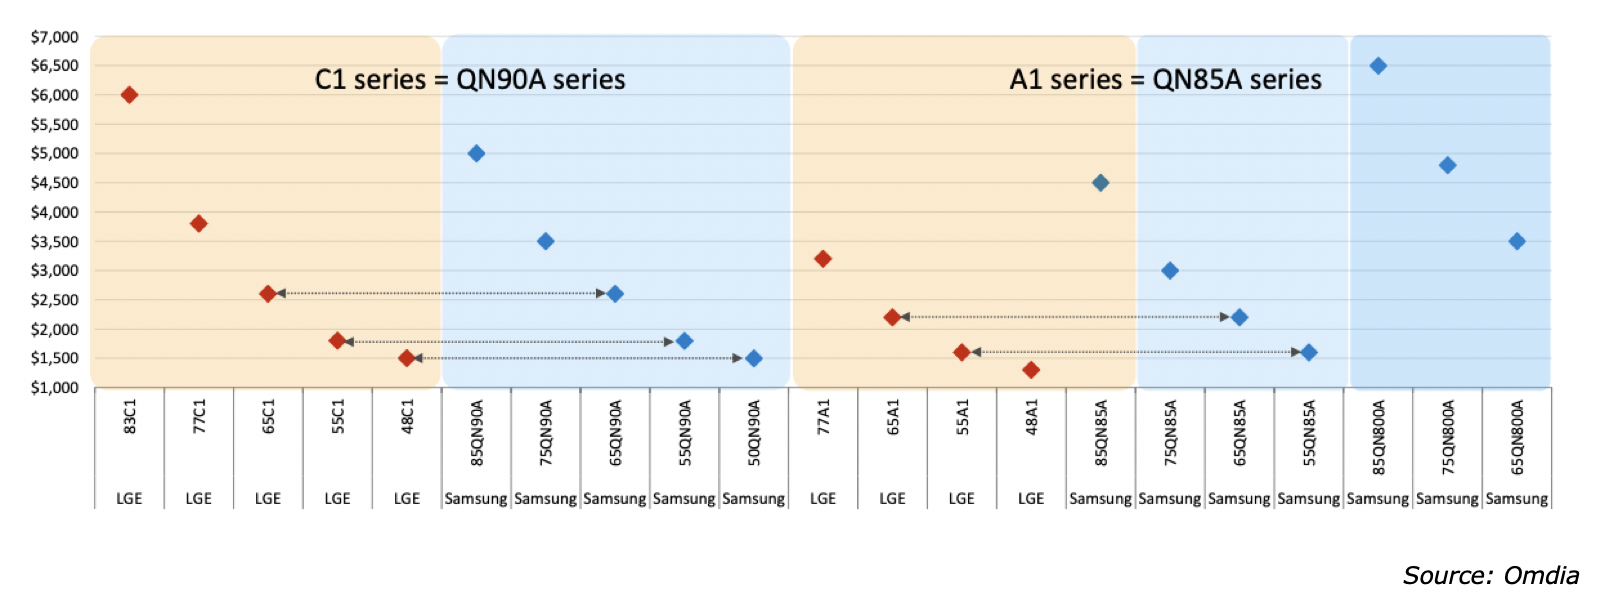
Figure 11: Price Strategy LGE OLED vs. Samsung NeoQLED TV
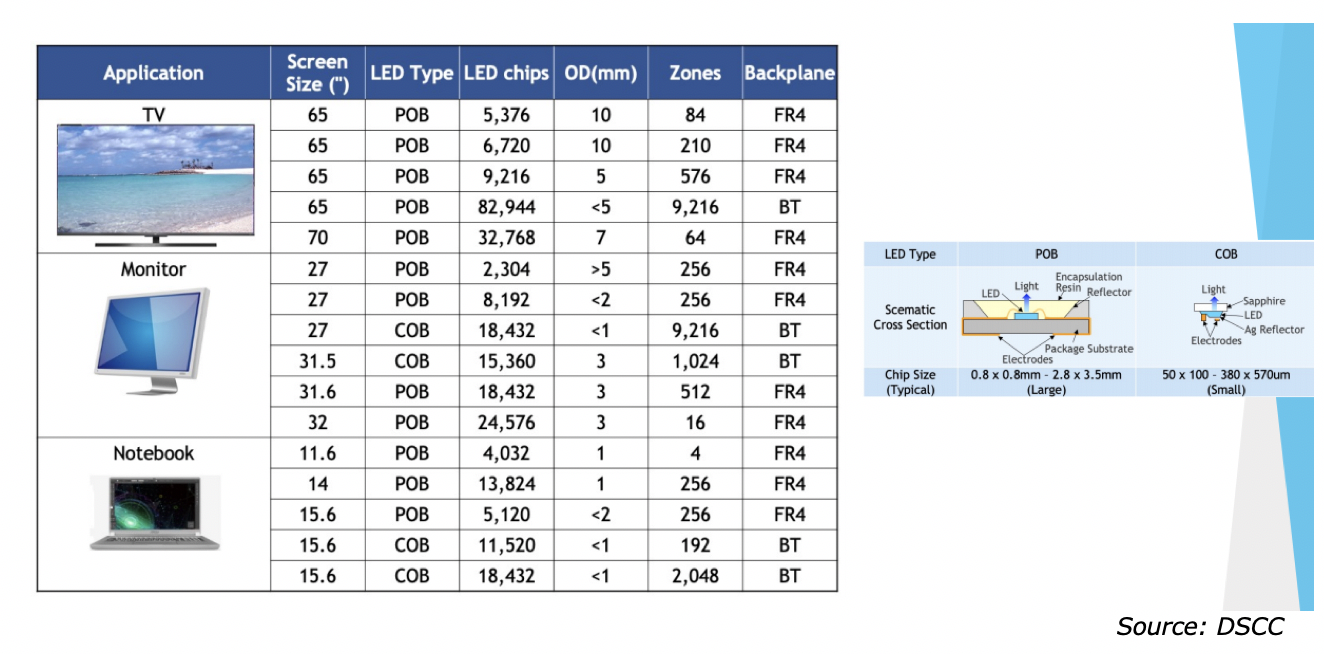
Mini LEDs are trending to increase the number of LEDs and the number of dimming areas to compete with OLEDs. As shown in the next figure, depending on the application, the current # of Mini LEDs vary from 5,000 to 82,000 and the dimming areas from 4 for notebooks to 9,000 for TVs. But the technology is maturing, and cost reductions are anticipated, increasing their performance, while concurrently reducing the cost.
Table 9: Mini LED LCD Configurations
Table 9: Mini LED LCD Configurations
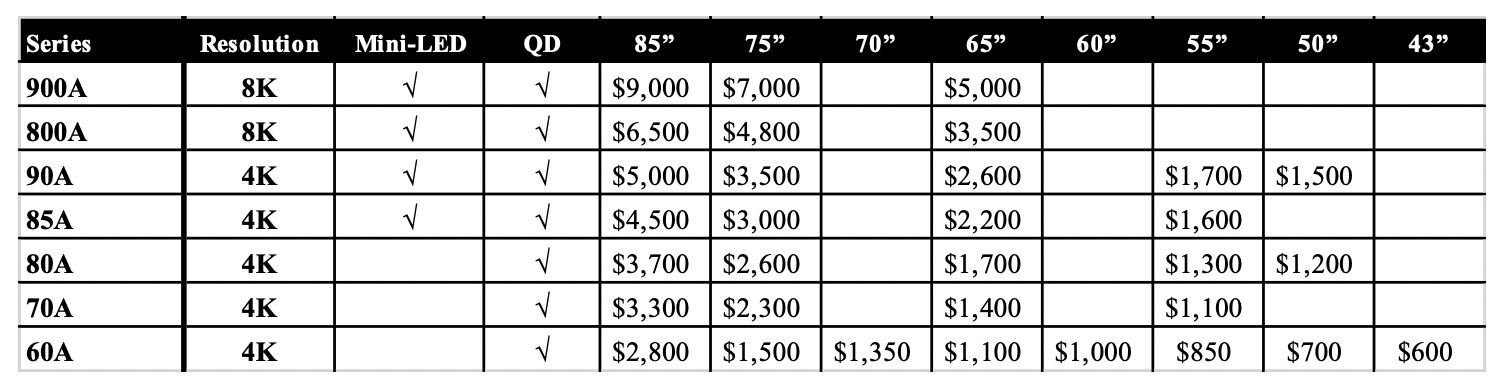
Samsung’s NEO QLED TV line which includes both 8K and 4K models and a combination quantum dot enhanced mini-LED backlit and LED sets. While each series has slightly different feature sets, it is obvious that Samsung is looking to both promote 8K and mini-LED backlighting in these series, while appealing to almost every price point between $9,000 and $600. LGE does not have the range, but where the match-up is comparable, Mini LED vs. OLED the prices are virtually the same.
Table 10: Neo QLED Features and Prices
Table 10: Neo QLED Features and Prices
Smartphone panels generate the most display revenue are 10X the volume of other applications and it is where OLEDs have made the most inroads. Samsung has effectively challenged all the panel makers by raising the technology stakes with a range of innovations:
Samsung’s technology innovations and the associated capex has resulted in a dominant position and the growth of OLEDs share of smartphone panels, which was 7% in 2020, even as the smartphone volume contacted and is forecast to grow by 28% in 2021, reaching a market share of 40% in 2021, up from 30% in 2019.
Figure 12: Smartphone Shipments by Display Technology and Folded Panel Share
- First was the flexible display, which used a yellow PI backplane
- The foldable display is an outgrowth of flex, which required a thinning process, new cover lens, first CPI and now UTG, combining layers, the latest being replacing the circular polarizer, with a combination black PDL and a color filter.
- Integrated Touch
- Under panel camera and sensors, which have been tried by others, but found wanting until released by Samsung
- LTPO, developed initially by Apple, implemented by LG for the Apple Watch, but installed first in smartphones by Samsung
Samsung’s technology innovations and the associated capex has resulted in a dominant position and the growth of OLEDs share of smartphone panels, which was 7% in 2020, even as the smartphone volume contacted and is forecast to grow by 28% in 2021, reaching a market share of 40% in 2021, up from 30% in 2019.
Figure 12: Smartphone Shipments by Display Technology and Folded Panel Share
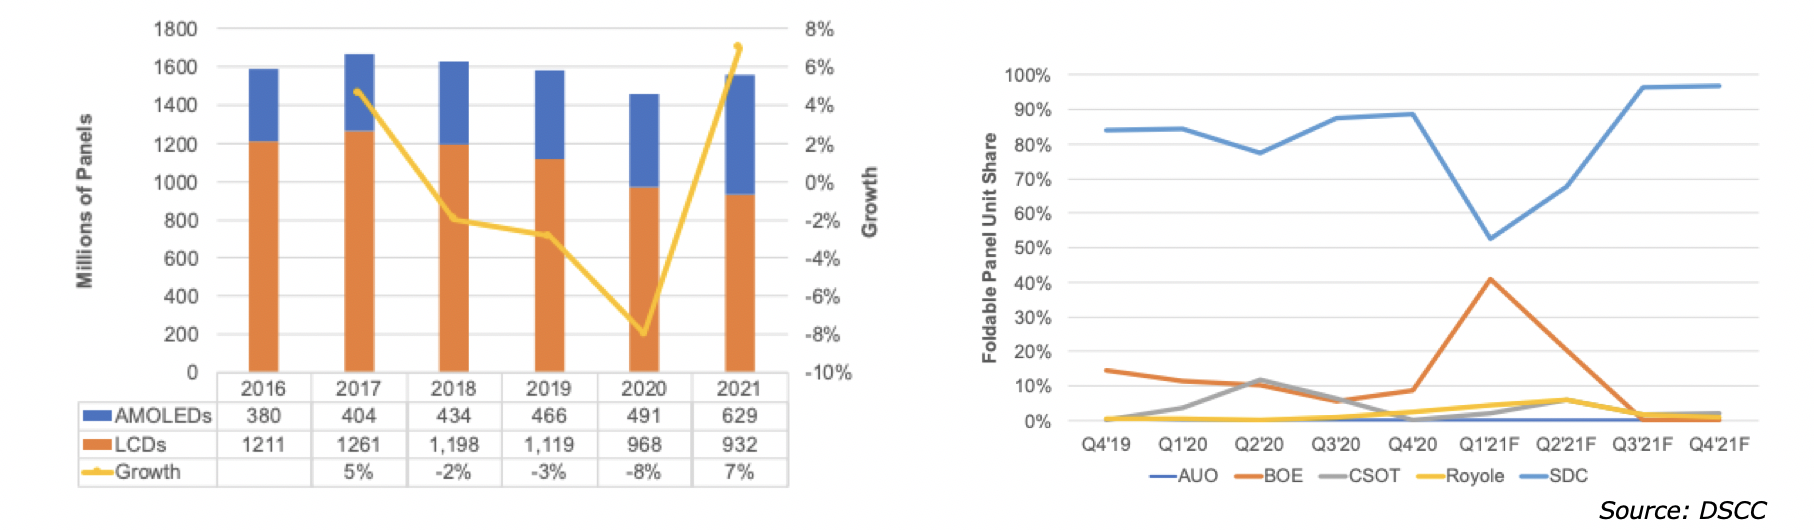
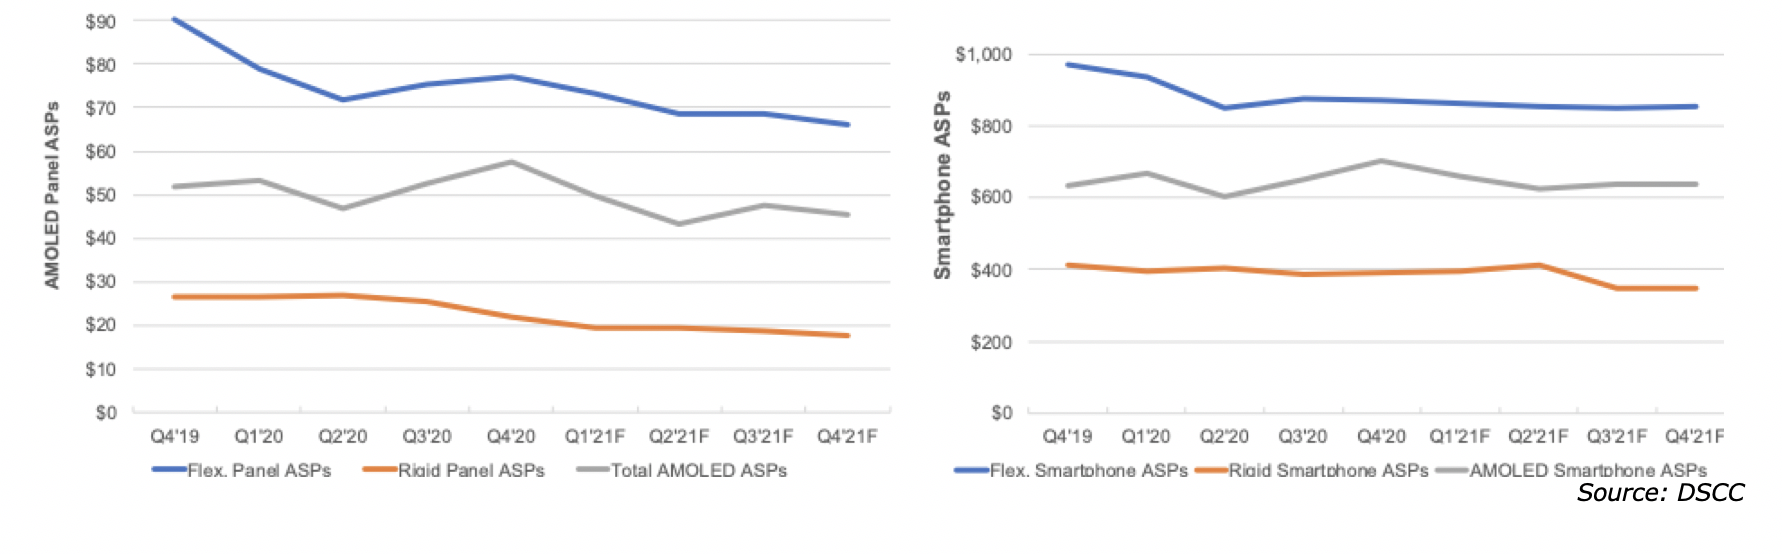
Figure 13: Smartphone Panel ASPs
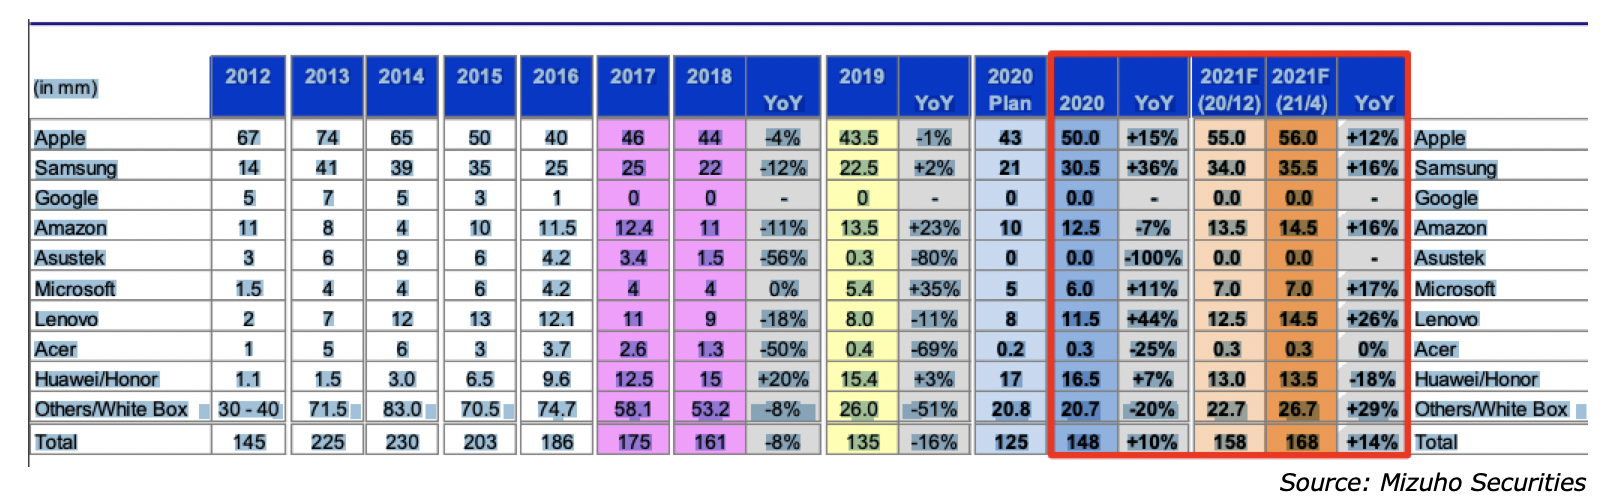
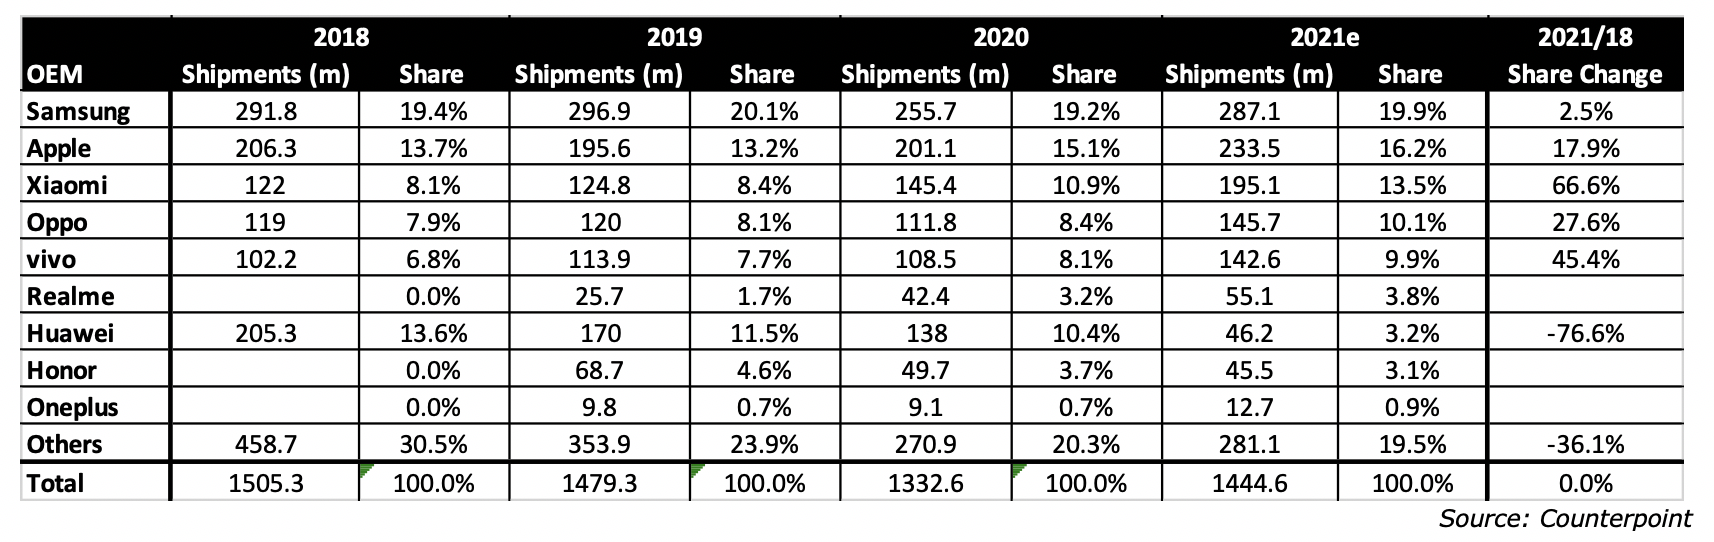
The top OEMs have remained the same between 2019 and the 2021 forecast, with the exception of Huawei dropping out due to the restrictions imposed by the US. Volume is forecast to be slightly down comparing 2019 with 2021 forecasts.
Table 11: Smartphone Shipment Trends by Brands
Table 11: Smartphone Shipment Trends by Brands
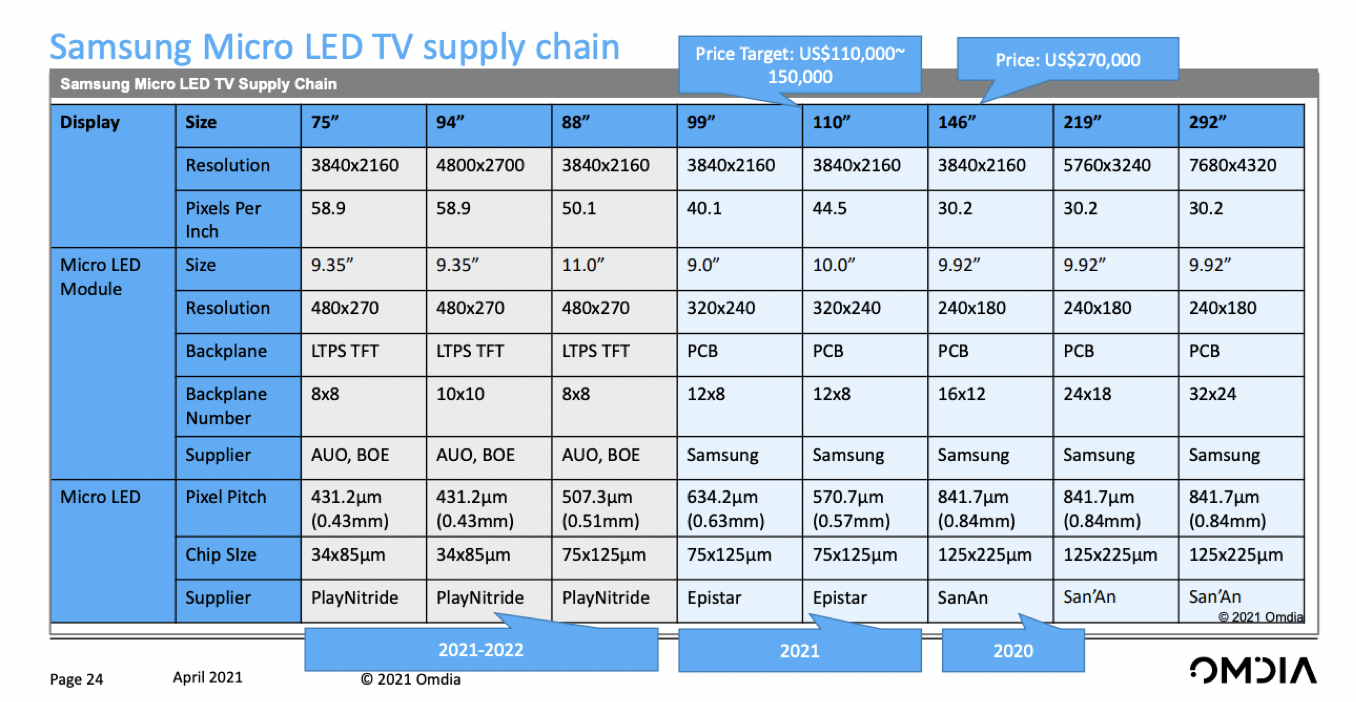
DisplayWeek includes many talks and several announcements of MicroLED technology and prototypes, but the only real products to date are the TVs produced by Samsung and Sony, which use LEDs that are 34x85um, up to 125x225um. The challenge remains, how to transfer millions of LEDs from a carbon or sapphire substrate cost effectively and at high yields. There were a number of talks on different processes and yield improvement measures, but it still appears to be a daunting task. While Samsung didn’t discuss their QNED process, which involves IJP nm size LEDs, it is the only technique that has the throughput to meet the TACT and cost for large area displays. In the interim, DisplayWeek demonstrated that the emerging MicroLED revolution is on hold.
Table 12: Samsung mLED (uLED) TV Supply Chain
Table 12: Samsung mLED (uLED) TV Supply Chain
The display industry has reached a mature level, where long term growth is limited and the two driving applications, TVs in area and smartphones in revenue are not growing. The reasons are palpable:
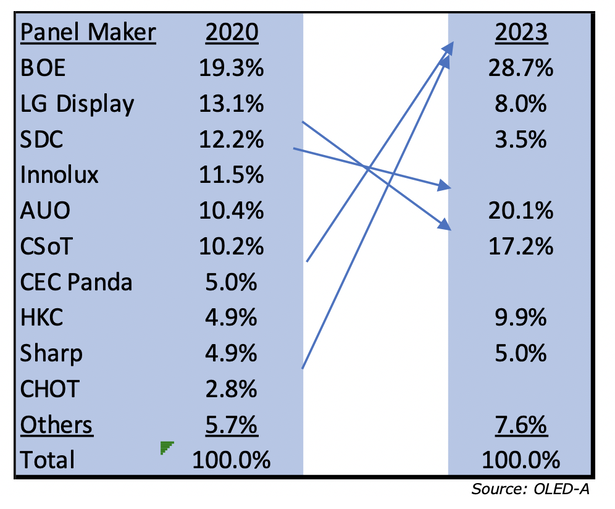
The industry has absorbed major changes over the last 10 years. In 2011, SDC and LGD had almost a cumulative 45% share of capacity
The Chinese government is likely to play a major role in the next phase, but it won’t be in providing capital. Now that the Chinese government has succeeded in shifting the center of the display industry from Korea to China, the government will be motivated to increase its return on capital by helping the larger panel makers absorb the smaller ones that have negative free cash flows. Plus, LG and SDC will eventually have to rationalize their LCD capacity, which under normal circumstances would be non-competitive. The likely consolidation steps, include:
Table 13: Possible Panel Maker Configuration
- The installed base for smartphone is estimated at 4b, the population of 7.8b people is growing at 1%/year and the majority of the growth is in regions where smartphones are unaffordable, the average replacement time is ~ 3.3 years. Demand based on population growth and replacement time adds up to ~1.1b smartphones/year, so the current level of 1.4b/year represents the upper end of demand unless there is a technology event causing a shortening of the replacement time, which has been increasing with rising prices.
- TV shipments growth has been demonstrated to be a function of the # of new households reaching $6,000 per year and the 10 year replacement cycle. TV shipment growth is now more a function of the increased average panel size than the number of new TVs shipped. Two events over the last 50 years changed this status, 1) the switch from black and white CRTs to color and the switch from CRTs to flat panels. OLEDs, Mini LEDs, Smart TVs, 4K, 8K have had virtually no impact on industry shipment growth
The industry has absorbed major changes over the last 10 years. In 2011, SDC and LGD had almost a cumulative 45% share of capacity
- Ten years later, BOE has a 25% share followed by CSoT at 17%
- The 3 leading LCD panel makers had a 44.6% capacity share in 2020, growing to 52.8% by 2023
- Capacity dominance has shifted from Korea to China, while the Korean’s have maintained their technology lead.
The Chinese government is likely to play a major role in the next phase, but it won’t be in providing capital. Now that the Chinese government has succeeded in shifting the center of the display industry from Korea to China, the government will be motivated to increase its return on capital by helping the larger panel makers absorb the smaller ones that have negative free cash flows. Plus, LG and SDC will eventually have to rationalize their LCD capacity, which under normal circumstances would be non-competitive. The likely consolidation steps, include:
- BOE absorbing CEC Panda
- CSoT absorbing Samsung Suzhou
- HKC expanding capacity
- By 2023, the major changes expected include Samsung and LGD exiting the LCD market except for LG’s 8.0% of LCD capacity used for IT; BOE absorbing CHOT, Innolux
- If the Chinese allow LCD prices to return to the 2019 levels, it could cause consolidation in Taiwan. Given that Innolux’s parent, Foxconn has turned negative on the display industry caused by losses at Sharp and their Gen 10.5 fab in China, a case could be made for an AUO takeover.
- The net result would be a collapse of the LCD industry from 6 suppliers in 2020 with double digit market shares to three.
Table 13: Possible Panel Maker Configuration
The obvious question for LGD and SDC is, 1) can they maintain or even increase their lead in OLED technology and 2) is the MicroLED evolution real, in what timeframe and for which applications.