Vertical Divider
Musing Commentary on August 22, 2021
The Uncertain Outlook for LG Display
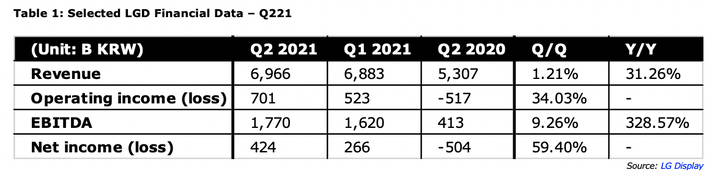
LG Display’s earnings growth in Q221 was its strongest in recent years. The company has had a string of strong quarterly earnings growth coming after suffering six consecutive quarters of net losses. The latest quarterly report was in some ways the best in years. Q221 revenue increased by 31.3% Y/Y to KRW6,966B ($6.03B), a record high for a second quarter. Net income went from minus KRW504B a year ago to plus KRW424B or $0.37B. EBITDA increased by 328.6% YoY to KRW1,770B ($1.53B). The table below summarizes the numbers for Q2 2021.
The Uncertain Outlook for LG Display
LG Display’s earnings growth in Q221 was its strongest in recent years. The company has had a string of strong quarterly earnings growth coming after suffering six consecutive quarters of net losses. The latest quarterly report was in some ways the best in years. Q221 revenue increased by 31.3% Y/Y to KRW6,966B ($6.03B), a record high for a second quarter. Net income went from minus KRW504B a year ago to plus KRW424B or $0.37B. EBITDA increased by 328.6% YoY to KRW1,770B ($1.53B). The table below summarizes the numbers for Q2 2021.
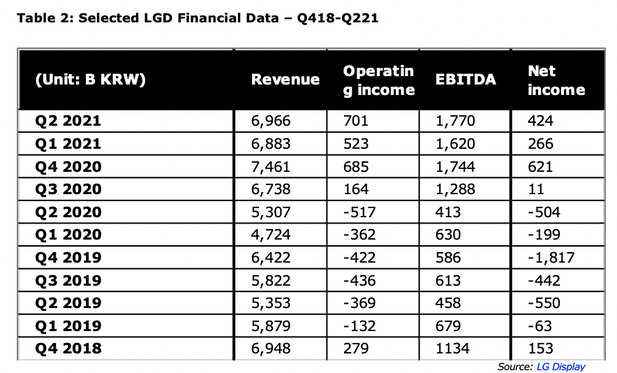
Earnings have steadily increased in each of the last four quarters as shown in the table below, the spike in Q4 is a seasonality expectation. These gains have offset the losses incurred in the six consecutive quarters beginning in Q1 2019. As a result, LGD improved the health of its balance sheet. Cash increased by 20% Y/Y to KRW4317B ($3.74B) and total debt decreased by 5.6% Y/Y to KRW13,818B ($11.97B). Net debt declined by 14% YoY to KRW9,501B ($8.23B). The net debt to equity ratio declined by 22 percentage points Y/Y to 69%. The liabilities to equity ratio declined by 26 percentage points Y/Y to 164%. LGD has come a long way.
The next table below the quantity and the value of the display panels shipped in Q221. Capacity increased by 3.6% Q/Q to 11.6M square meters and shipments increased by 4.7% Q/Q to 8.9M square meters, but average selling prices declined by 4.5% Q/Q to $703 per square meter. TV panels accounted for 38% of revenue, up 15 points Y/Y, but IT panels fell by 13 points Y/Y to 39% and mobile declined by 2 points Y/Y to 23%. In general, ASPs tend to drop as large area m2 increase as a percentage of total shipments, since small/medium ASP/m2cis the highest of all the panel categories.
The next table below the quantity and the value of the display panels shipped in Q221. Capacity increased by 3.6% Q/Q to 11.6M square meters and shipments increased by 4.7% Q/Q to 8.9M square meters, but average selling prices declined by 4.5% Q/Q to $703 per square meter. TV panels accounted for 38% of revenue, up 15 points Y/Y, but IT panels fell by 13 points Y/Y to 39% and mobile declined by 2 points Y/Y to 23%. In general, ASPs tend to drop as large area m2 increase as a percentage of total shipments, since small/medium ASP/m2cis the highest of all the panel categories.
Market Gyrations commented that LGD should post good numbers throughout 2021 and 2022, but claims trouble is lurking with increased panel production on the horizon. Guidance calls for display area and ASP to increase by mid-single digit Q/Q in Q3, but shortages of semiconductors could affect the numbers. Earnings have been strong, but the arguments in favor of long term growth are offset by the arguments against it.
LPL's market cap stands at around $6.9B and its enterprise value is about $15.92B due to high levels of net debt as mentioned earlier. If revenue and EBITDA on a TTM basis is KRW28,048B or $24.31B and KRW6,422B or $5.57B respectively, then LGD’s enterprise value of $15.9B is equal to about 2.9 times EBITDA. Its price to sales ratio stands at just 0.35. Some may argue the company is undervalued considering its size and its pace of growth.
LPL's market cap stands at around $6.9B and its enterprise value is about $15.92B due to high levels of net debt as mentioned earlier. If revenue and EBITDA on a TTM basis is KRW28,048B or $24.31B and KRW6,422B or $5.57B respectively, then LGD’s enterprise value of $15.9B is equal to about 2.9 times EBITDA. Its price to sales ratio stands at just 0.35. Some may argue the company is undervalued considering its size and its pace of growth.
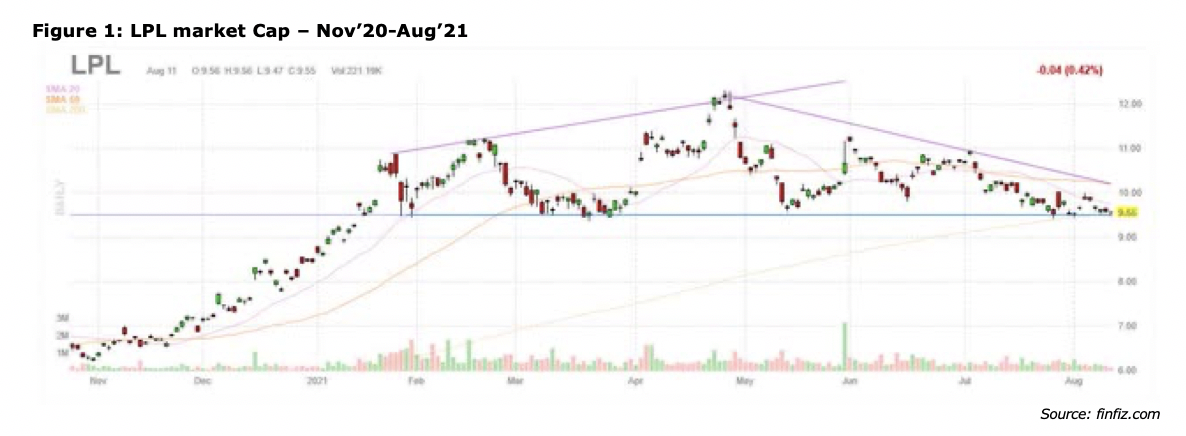
“Chartists” see a head and shoulders pattern. There's a baseline with three peaks, the middle one being the highest and the left and right one roughly equal in height. The head and shoulders pattern are considered bearish, a sign the existing trend is about to end, and the trend is about to reverse to the downside. The OLED TV market could reach 8M units in 2021 for a 3% share of the TV market, up from 4.7M units in 2020.
With ASPs for large area LCD panels more than doubling since 2019, China’s panel makers are increasing LCD panel capacity, which will convert the shortages to a glut and put pressure on LCD prices. We agree with Market Gyrations assessment on the impact of the LCD glut, but OLED TV demand does not synch with LCD demand. For LGD:
Unfortunately for LGD, the nay sayers are prevailing and the stock has not done well, even with quarterly numbers hitting record highs. There are increasing signs that more output is heading for the display market and that could upset the delicate balance in the display market, which will have less effect on LGD than the LCD centric companies. The market does not assign a lot of value to LGD and the reasons, seem to be the past problems that plagued the company and the display industry for a long time.
LGD made the right decision to become a pure play OLED company and that decision is starting to pay off. The financial market experts just need to catch up.
Zacks Investment Research from a "sell" rating to a "hold" rating in a research report issued on 8/13/21. Large Investor changes:
With ASPs for large area LCD panels more than doubling since 2019, China’s panel makers are increasing LCD panel capacity, which will convert the shortages to a glut and put pressure on LCD prices. We agree with Market Gyrations assessment on the impact of the LCD glut, but OLED TV demand does not synch with LCD demand. For LGD:
- The drop in LCD panel prices should reduce LGD’s profit and eventually cause them to close or shift some of their LCD capacity. However, by shifting production from TVs to IT they could delay the impact of the changes.
- OLED TV panel demand has consistently been tied to TV panel capacity. LGD sells all the panels it can produce . In the next two years, only Samsung’s 30K substrate capacity will be added to the competitive landscape.
- As LCD prices drop, LG may have to reduce the OLED prices to 2020 levels, but they are also increasing capacity, which should offset any drop in prices.
- The big decision for LCD is their Gen 10.5 fab, when and if to invest in it. While capex is a major consideration, the real issue is what is the size of the OLED TV market. As LG succeeds competitors will target the space.
- Market Gyrations also questioned LGD’s upcoming investment in small/medium OLED, since the company has struggled in the past. However, they seemed to have found the formulas they are competitive with Samsung in performance, and their market share with Apple, the leading supplier of OLED smartphones is growing.
Unfortunately for LGD, the nay sayers are prevailing and the stock has not done well, even with quarterly numbers hitting record highs. There are increasing signs that more output is heading for the display market and that could upset the delicate balance in the display market, which will have less effect on LGD than the LCD centric companies. The market does not assign a lot of value to LGD and the reasons, seem to be the past problems that plagued the company and the display industry for a long time.
LGD made the right decision to become a pure play OLED company and that decision is starting to pay off. The financial market experts just need to catch up.
Zacks Investment Research from a "sell" rating to a "hold" rating in a research report issued on 8/13/21. Large Investor changes:
- Renaissance Technologies LLC raised its stake in shares of LG Display by 68.4% in the second quarter. Renaissance Technologies LLC now owns 142,500 shares of the electronics maker's stock worth $1,523,000 after purchasing an additional 57,900 shares during the last quarter.
- OLD Mission Capital LLC purchased a new position in shares of LG Display in the second quarter worth about $273,000. Liberty Wealth Management LLC raised its stake in shares of LG Display by 355.2% in the second quarter.
- Liberty Wealth Management LLC now owns 3,560 shares of the electronics maker's stock worth $333,000 after purchasing an additional 2,778 shares during the last quarter.
- SG Americas Securities LLC raised its stake in shares of LG Display by 25.9% in the second quarter. SG Americas Securities LLC now owns 255,988 shares of the electronics maker's stock worth $2,737,000 after purchasing an additional 52,650 shares during the last quarter.
- Grantham Mayo Van Otterloo & Co. LLC purchased a new position in shares of LG Display in the second quarter worth about $277,000. Hedge funds and other institutional investors own 2.27% of the company's stock.