Vertical Divider
Apple’s Market Cap Influenced by Fed’s Liquidity Expansion
July 05, 2020
Last week, we discussed the liquidity surge instituted by the Fed to prop up the stock market. Under normal circumstances, the market's performance mirrors the anticipated future performance of the economy. But the Fed's rampant liquidity infusions has driven equities up, Apple being a prime example. As fundamentals come back to Earth, so should valuations. Apple’s P/E ratio, now at 28:1 has rebounded to levels not seen since 2008, when the impact of the iPhone was just beginning to take hold.
Figure 1: Apple Price, EPS, PE Ratio

The overall market is up a staggering 38% since it hit the bottom. Despite a terrible, and slowly recovering economy, the market is acting as if none of this ever happened. The Nasdaq recently minted new highs, while the S&P 500 and Dow are returning to return to old highs. The Fed has enabled this divergence between the market and the economy The particular equities to pre-COVID-19 highs. As we pointed out last week, at some point the flood of funding the Fed has gushed into the market will ends and the market will be left to fend for itself. As the reality sets in that the economy is not in great shape and the Fed's money printing will not solve unemployment or horrible Q2 earnings, the Fed’s inflating tacit will be rendered impractical .
The market versus economy dynamic is best exemplified by Apple, which is now valued north of $1.5 trillion. Here's a chart of Apple since its pre-COVID-19 top.
Figure 2: Apple Market Cap
The market versus economy dynamic is best exemplified by Apple, which is now valued north of $1.5 trillion. Here's a chart of Apple since its pre-COVID-19 top.
Figure 2: Apple Market Cap
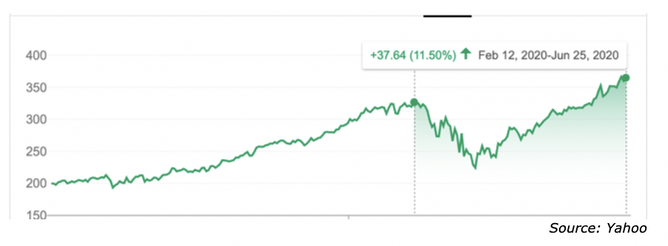
Apple is up 11% from its prior peak, even with the knowledge of COVID-19's disastrous economic impact. Given the slowdown in consumer buying, Apple should be heavily exposed to a COVID-19-prone economy. Apple manufactures luxury hardware devices. In an economy where unemployment is 13%, luxury goods, especially ones sold en masse, should take a hit and yet, Apple’s market cap is at an all-time high. Recently, Apple analysts have issued slew of price target increases on the back of (mostly) the 5G smartphone upgrade cycle, which are expected to be much weaker than expected in 2020.
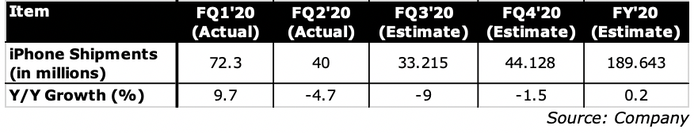
Shipments of mmWave-enabled 5G iPhones slated for launch later this year are expected to be 15-20 million units in 2020 compared to previous supply chain estimate of 30-40 million units, and FQ3 shipments are forecast to drop 9% Y/Y and would be even lower had Apple not launched the iPhone SE last quarter. Suppliers have been asked to build more than 45M older models for the second half of 2020, in a move to shield the company in case of any delays to the 5G iPhones. While strong SE unit demand mitigates the negativity in pricier models, it will bring the overall ASP attach rate of the whole mix down. Longer term the impact should be positive. Based on the unit sales data, Counterpoint projects an ASP of $727.91, compared to full-year ASPs in FY'19 of $752.54/iPhone. Considering the higher ASP models released in FQ4 will have an almost non-existent impact on full-year ASPs, the biggest driver of selling prices will be iPhone SE sales. For FY2020, anticipate a decline of ~7% in ASPs to ~$699.86/device and iPhone revenues of $132.723 billion, down ~6.8% Y/Y.
Table 1:iPhone Quarterly Shipments vs. Y/Y Growth
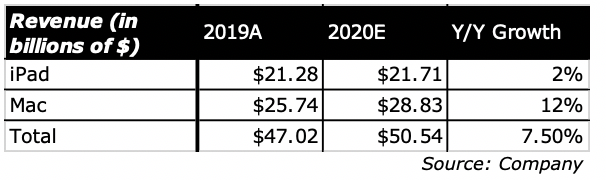
Mac and iPad shift to ARM-based processor will likely improve cost efficiency in their design. This is evidenced by ARM's cost efficiency leadership over Intel in the datacenter segment. Improved cost efficiency will mean improved performance and margins. Coupled with ongoing work-from-home trends bolstering laptop demand, and Mac revenues could be a strong point for the company this year. iPad revenue should be up minimally on a Y/Y basis also, as enterprises may buy iPads in addition to Macs for WFH needs. But the ARM conversion, won’t happen until 2021, when the work-from-home trend could dissipate.
Table 2:iPad/Max Revenue
Table 2:iPad/Max Revenue
Moving on to the highest-growth segment of Apple's hardware business, its "other" business segment includes AirPods and the Apple Watch. Analysts expect moderate growth in Apple Watch this year, but strong than anticipated AirPods growth. Counterpoint expects ~100 million AirPods demand this year (pre-COVID-19), versus the ~60 million units shipped last year, putting hardware revenue at $212.6b down 0.6% Y/Y, with gross margins at 32.5% up slightly Y/Y.
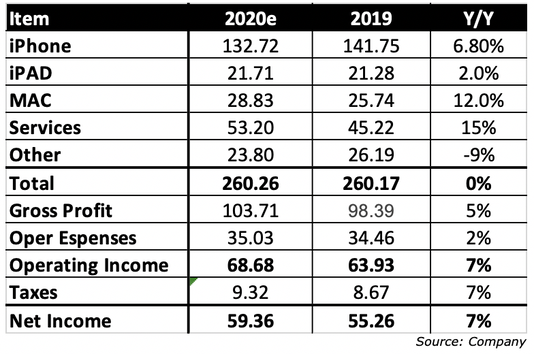
Software is Apple's services business segment. In FQ2, the company saw Y/Y growth of ~16.5% from its services segment. Taking a long-term view, services will likely be a high-margin, but slower-growth software business. The services business is already very large, representing ~$46 billion in total revenue in 2019. The main business segments of services are licensing (mostly with Google (GOOG)) and the App Store. AppleCare+ is quite literally device insurance. More sales equate to greater AppleCare+ revenue. Less sales equate to less AppleCare+ revenue. The iTunes Store, while still contributing to revenue, is beginning to die off quite a bit, which will reduce the overall revenue growth of the services segment. The one segment that will likely drive growth at services for years to come is the App Store, as it is in no way correlated to device revenue. The App Store is essentially a pure play on increased usage of mobile phones in general. Apple Music could also see improved revenues as music streaming becomes a much more mainstream business in the music industry. Then there is Google, which essentially pays Apple to be the default search engine on the iOS operating system. This revenue could be inconsistent and choppy in the coming years, and is a risk to growth going forward as the government challenge’s Apple’s right to demand 30% of each transaction. .Software revenue for 2020 has been projected at $53.2b up 15.0% Y/Y with a gross margin of 65.0% up 2%.
Gross profit for Apple comes out to $103.71 billion. 66.6% of this comes from the company's hardware business. Full-year operating expenses are estimated at $35.028 billion. Resulting in $68.682 billion in full-year operating income. Deduct 16.5% out for taxes and net income is $57.349 billion. On 4.33 billion outstanding shares, non-GAAP EPS estimate is $13.24/share, well north of consensus numbers. Assume 66.6% of this $13.24/share is hardware earnings. $8.74/share of Apple earnings are derived from hardware, while the other $4.50/share is software.
Cyclical hardware tech companies trade at 10X-15X earnings. But Apple warrants a higher valuation for these reasons: 5G upgrade cycle boost, long-term wearables tailwind, work-from-home boost to Mac and iPad, strong margins and brand. For this reason, a multiple of 20X is warranted. Applying this multiple to $8.74/share in earnings, Apple's hardware business is worth $174.80/share. Putting 25X multiple on the software business. On $4.50/share in software earnings, the value for Apple's software services business is $112.50/share. Put these two valuations together and Apple would be worth $287.30/share. The Fed's rampant liquidity infusions into the market has driven equities up, and Apple being a prime example. As fundamentals come back to Earth, so should valuations. Apple at ~$360 looks a bit over bought!
Note: The above calculations exclude Other Income (non-product related), which are provided in the table below.
Table 3: Apple Revenue by Category+ Selected Financial Results
Apple will keep the price of the 5G iPhone 12 comparable to the 4G iPhone 11, you just won’t be able to charge it. Analyst Kuo, who previously said that Apple will no longer include wired earbuds with the iPhone 12, and now reports that the power adapter will be sold separately too. Kuo says that Apple wants to keep selling the iPhone 12 at a similar price to the iPhone 11 and removing in-box accessories will offset the cost of the 5G networking components, which will reduce the size of the iPhone packaging lowering Apple’s freight costs. Kuo didn’t say if the Lightning cable is still included. Apple’s other products, the Series 3 Apple Watch includes the magnetic charging cable but does not come with the wall plug / power adapter. Kuo says that the previously-pictured 20 W power adapter is legitimate but will not come with the iPhone 12 and will be sold separately. Apple is discontinuing both the current 5W and 18 W chargers in favor of the new 20 W model. For Apple’s upcoming iPad line, consisting of a new 10.8-inch iPad later this year and 8.5-inch iPad mini in the first half of 2021, Kuo thinks Apple will continue to bundle the power adapter. Since the majority of sales, will be for iPhone replacements, Apple expects most buyers will already have a number of chargers and earbuds lying around, so their removal may not be an inconvenience in practice. However, it will surely lead to complaints that Apple is price-gouging for all accessories. The removal of in-box earbuds is believed to help increase sales of Apple’s AirPods range. From: Seeking Alpha