Vertical Divider
2020 Large Area Panel Shipments reach 821m Up 14.5% Y/Y
An examination of large panel display shipments since 2013, shows the largest change large panel shipments was in 2018, when the industry saw a 7.1% increase. In 2020 the growth was 14.5% Y/Y with only TV panel unit volume declining y/y. The table below breaks down each segment in 2020.
Table 1: 2020 Y/Y Change for Large Area Displays
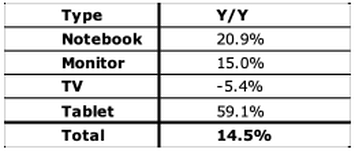
Table 2: Large Panel Display Shipments - 2020
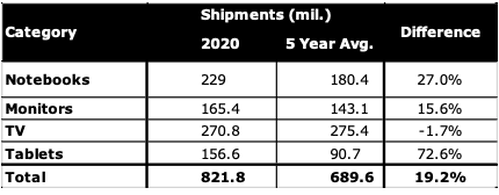
Table 3: 2020 Large Panel Shipment Growth vs. Averages
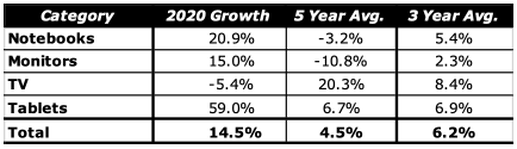
The tables show that other than TV panels, each category grew substantially, however a portion of that growth would have to be attributed to what would be ‘normal’ yearly growth for each category, however if we compare shipments in 2015 to shipments in 2019 we can see the inherent growth rates are not always positive.
Figure 1: Quarterly Global Large Area Panel Shipments by Application
Figure 1: Quarterly Global Large Area Panel Shipments by Application
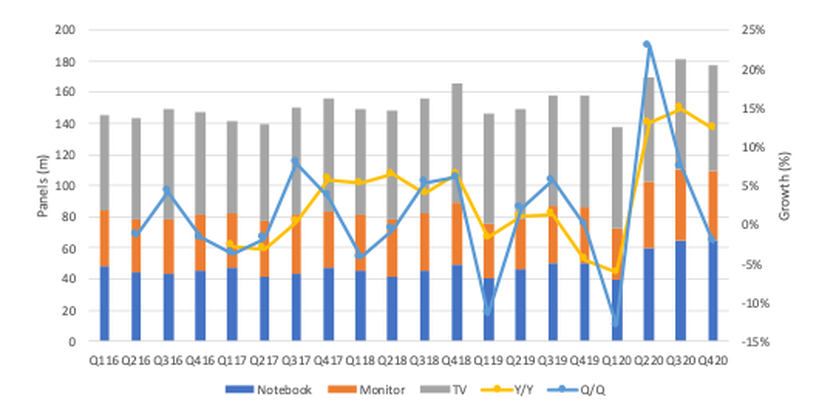
Based on the table data above, in 2020, Notebooks and Monitor panels grew against negative 5-year shipment growth rates, so we included a column for 3 year growth rates to give some perspective and smooth yearly variations. Against the 3 year averages Notebook panel shipments grew almost 4x times the averages while Monitor panel shipments grew over 6.5x the 3 year averages. TV panel shipments were the opposite, falling against both 5 year and 3 year averages, while tablets grew an astounding 8.8x against the 5 year averages and 8.6x against the 3 year averages. Total panel shipments grew 3.2x and 2.3x against the 5 year and 3 year averages respectfully.
Figure 2: Quarterly Notebook Panel Shipments
Figure 2: Quarterly Notebook Panel Shipments
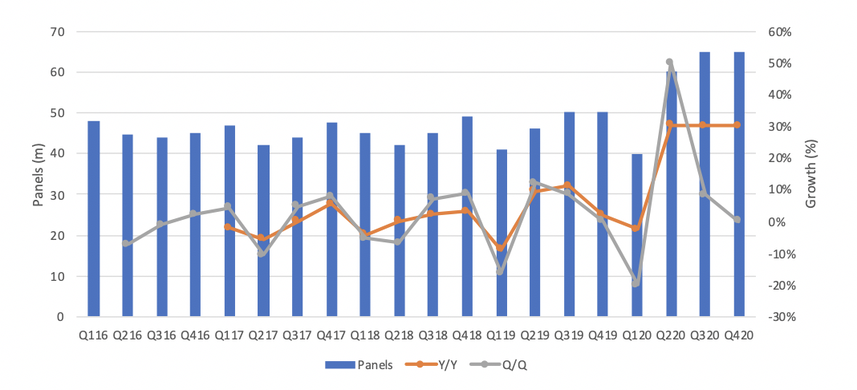
Figure 3: Quarterly Monitor Panel Shipments

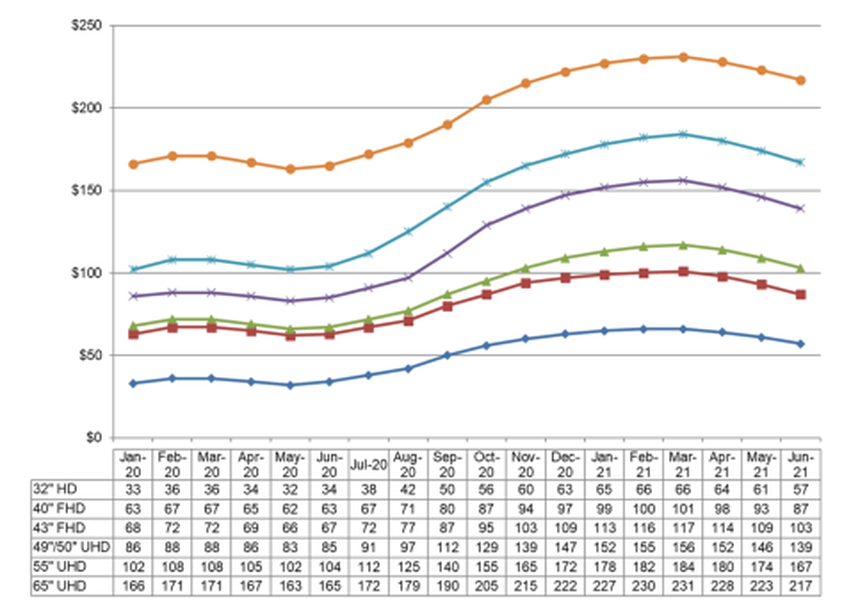
Panel prices increased more than 20% sequentially for selected TV sizes in Q3 2020, and by 27% sequentially in Q4 2020 with a projection of a 9% sequential increase in Q121.
Figure 4: Quarterly TV Panel Shipments
Figure 4: Quarterly TV Panel Shipments
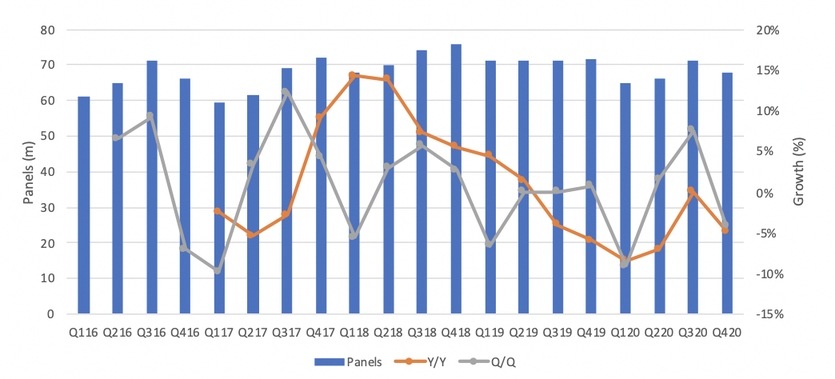
Figure 5: Monthly TV Panel ASPs