Vertical Divider
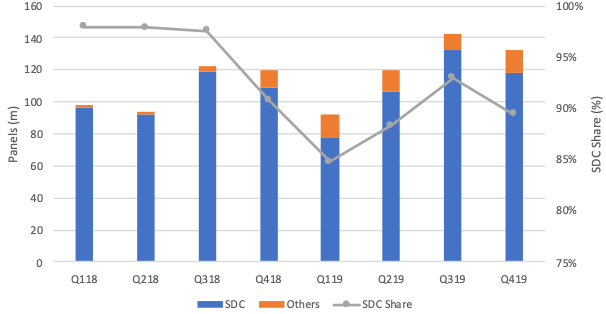
2019 OLED Panel Shipments Increase to 486m up 12% Y/Y
December 22, 2019
DSCC’s most recent report puts OLED panel shipments at 486m up from 434m in 2018. SDC share was 96% in 2018 and 89% in 2019, reflecting the entrance of many Chines panel makers especially BOE, which shipped 20m panels (~20% of the remainder) in 2019.
Figure 1: OLED Panel Shipments – Samsung and All Other
Source: DSCC Quarterly OLED Shipment and Fab Utilization Report
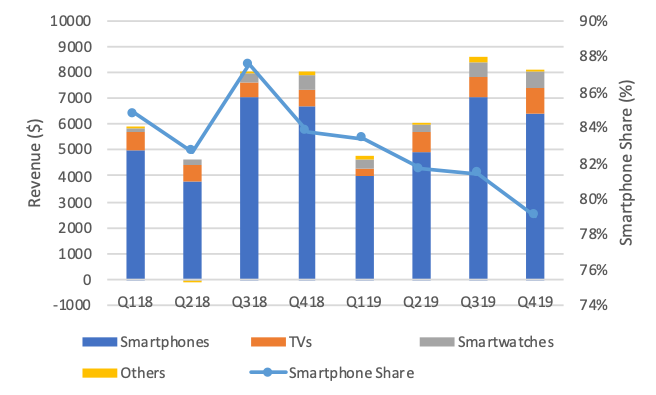
OLED revenues continue to be dominated by smartphone panels, as shown in the first chart here. OLED smartphone panel revenues came in at $6.9 billion in Q3 and we expect $6.4 billion in Q4, declines of 1% and 4% from their respective quarters in 2018. While TV remains the 2nd highest application by revenue, it is nearly matched by smartwatch revenue. TV panels will reach $639.1 million in Q4, followed by smartwatch revenues with $638.6 million. We estimate that smartwatch panel revenue will reach $1.88 billion for the full year 2019, an increase of 47% of 2018, while TV revenues of $2.4 billion manage only a 15% increase.
Figure 2: OLED Panel Revenue by Application
Source: DSCC Quarterly OLED Shipment and Fab Utilization Report
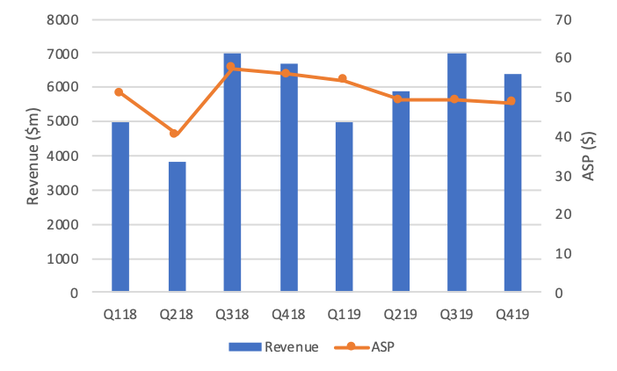
Figure 3: OLED Panel Revenue and ASP
Source: DSCC Quarterly OLED Shipment and Fab Utilization Report
Samsung Electronics continues to be the largest user of OLED panels, purchasing 224 million panels in 2019, an increase of 4% over 2018, followed by Apple with 59 million units. Apple’s purchases of OLED panels decreased 27% from 2018, with a sharp slowdown in the first half of 2019 as seen in the chart. Huawei was the #3 brand for OLED panel purchases with 50 million, an increase of 261% from 2018, and Huawei surpassed Apple in the first half. The full report shows OLED panel shipments to 24 different smartphone brands, but for simplicity we’ve included only the top 8 in this chart.
Figure 4: Smartphone Shipments with OLED Panels by OEM

Source: DSCC Quarterly OLED Shipment and Fab Utilization Report
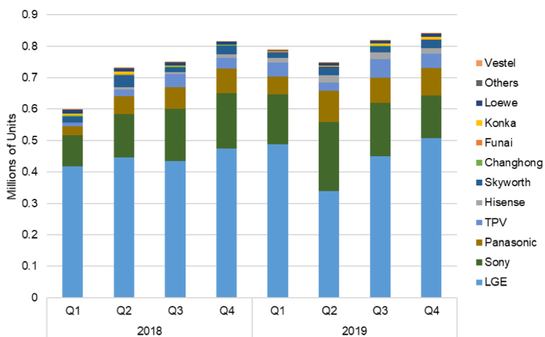
OLED TV panel shipments have increased 11% Y/Y in 2019 to 3.2 million units, with Q4 2019 registering a meager 3% Y/Y growth to 842,000 units. OLED TV shipments by LGD to various brands are shown in the next chart. While LGE remains the biggest customer for OLED TV panels, shipments to LG increased only 1% Y/Y in 2019 to 1.79 million units. LGD’s #2 customer Sony was a bit better with 18% growth Y/Y to 684k units. LGD made great strides in diversifying its customer base in 2019, with big increases in panel shipments to Hisense (+304% Y/Y), TPV (+59% Y/Y for the Philips brand), and Panasonic (+39% Y/Y) among others.
Figure 5: Quarterly OLED TV Panel Shipments by Brand, 2018-2019
Source: DSCC Quarterly OLED Shipment and Fab Utilization Report
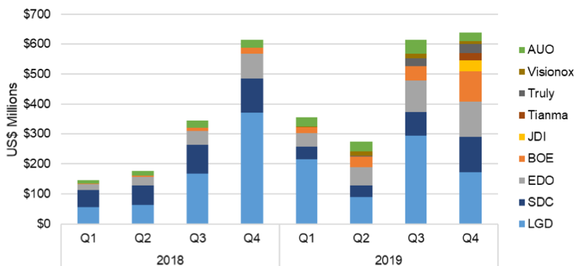
Smartwatch, a genuinely competitive battle has emerged among panel makers. With the majority of shipments for the Apple Watch, LGD has been the leader in smartwatch panel revenues for every quarter since Q3 2018, but LGD’s revenue share in Q4 2019 is estimated at only 27% as Samsung, EverDisplay, BOE and others achieved substantial portions of the market, and JDI appeared for the first time in this market with sales to Apple.
Figure 6:Quarterly OLED Smartwatch Panel Shipments by Panel Maker, 2018-2019
Source: DSCC Quarterly OLED Shipment and Fab Utilization Report
Figure 7: Smartwatch Display Shipments by Technology
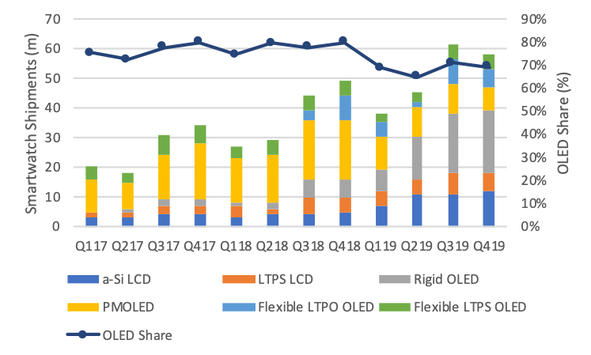
Source: IHS Markit
Figure 8: Smartwatch AMOLED Shipments, Revenue, ASP
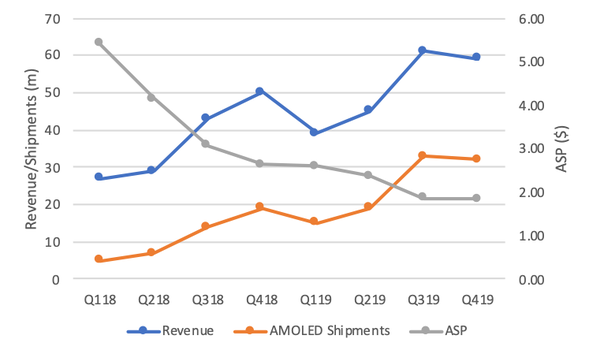
Source: DSCC Quarterly OLED Shipment and Fab Utilization Report, OLED-A
Among other applications, OLED Notebook panels are starting to emerge in noticeable volumes, with 800k units in 2019, nearly half of which (395k) came in Q4. Notebooks crept up above 1% of OLED panel revenues with $92 million in Q4.
Turning to the longer-term forecast, we expect OLED panel shipments for all applications to increase at a 16% CAGR to 1.07 billion units in 2023, from 500 million units in 2018. Smartphone will continue to dominate the shipments in units, as we forecast smartphone to be 84% of all shipments in 2023, down only slightly from 87% in 2018. While they will make up only a small portion of units, the growth of IT applications will be impressive (albeit from a low base), with notebook panel shipments growing at a 281% CAGR to 12.1 million units in 2023 and monitors growing at a 157% CAGR to 2.0 million units.
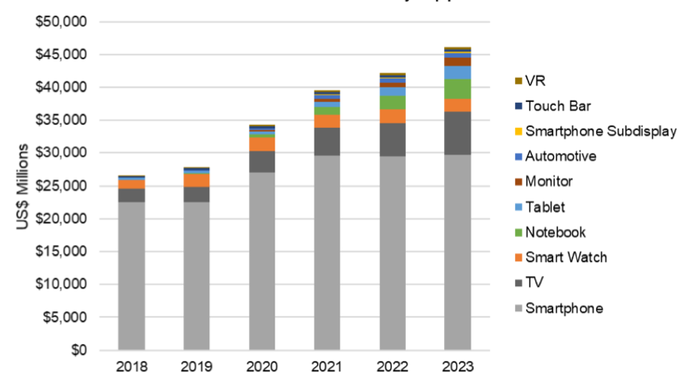
The final chart in this article shows our long-term forecast of OLED panel shipment revenues by application. We expect OLED revenues to increase at a 12% CAGR from $26.6 billion in 2018 to $46.1 billion in 2023, driven by growth across all applications, but especially beyond smartphone. We forecast smartphone revenues to grow by only a 6% CAGR across this time horizon to $29.7 billion in 2023, while TV panel revenues grow by a more impressive 26% CAGR to $6.5 billion. TV revenue increases will be driven by an increase in average screen size and by the introduction of higher-priced Samsung QD OLED TV panels to the mix.
Figure 9: OLED Panel Shipments by Application, 2018-2023
Turning to the longer-term forecast, we expect OLED panel shipments for all applications to increase at a 16% CAGR to 1.07 billion units in 2023, from 500 million units in 2018. Smartphone will continue to dominate the shipments in units, as we forecast smartphone to be 84% of all shipments in 2023, down only slightly from 87% in 2018. While they will make up only a small portion of units, the growth of IT applications will be impressive (albeit from a low base), with notebook panel shipments growing at a 281% CAGR to 12.1 million units in 2023 and monitors growing at a 157% CAGR to 2.0 million units.
The final chart in this article shows our long-term forecast of OLED panel shipment revenues by application. We expect OLED revenues to increase at a 12% CAGR from $26.6 billion in 2018 to $46.1 billion in 2023, driven by growth across all applications, but especially beyond smartphone. We forecast smartphone revenues to grow by only a 6% CAGR across this time horizon to $29.7 billion in 2023, while TV panel revenues grow by a more impressive 26% CAGR to $6.5 billion. TV revenue increases will be driven by an increase in average screen size and by the introduction of higher-priced Samsung QD OLED TV panels to the mix.
Figure 9: OLED Panel Shipments by Application, 2018-2023
Source: DSCC Quarterly OLED Shipment and Fab Utilization Report
Notebook will rise to the #3 application by revenue by 2023, registering a 286% CAGR from 2018 to 2013 and growing to $3.1 billion. In addition, smartwatch, tablet, and monitors will all represent markets with greater than $1 billion in revenue.