Vertical Divider
1H21 Fab Utilization Rising, Except For Flexible OLEDs
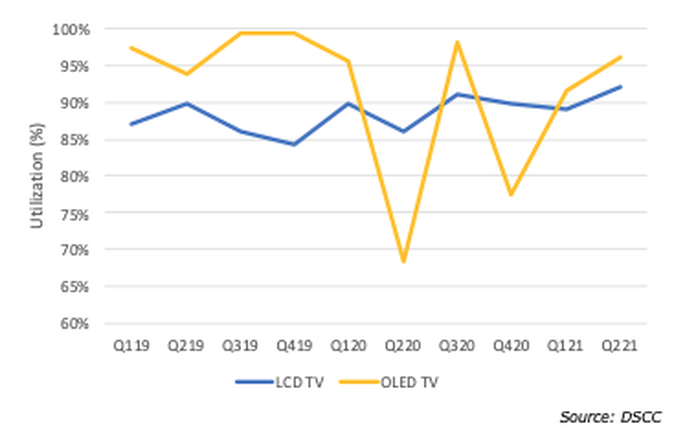
DSCC published fab utilization figures for 2019, 2020 and 1H 2021. In terms of TVs, LCD utilization remained steady between 85% and 90%, but jumped to 92.5% in Q221.
Figure 1: TV Fab Utilization LCD vs. OLED
DSCC published fab utilization figures for 2019, 2020 and 1H 2021. In terms of TVs, LCD utilization remained steady between 85% and 90%, but jumped to 92.5% in Q221.
Figure 1: TV Fab Utilization LCD vs. OLED
The increase is a response to the opportunity to generate additional profits by taking advantage of price increases in large area LCDs. OLED TV utilization operates in a much different magnitude, since capacity is limited LGD’s 2 facilities in Paju and Guangzhou. LGD kept utilization at the 95% level when it only operated the Paju Gen 8.5, but utilization varied markedly as they brought up the China facility. In Q221, LGD is back to 95% utilization and that level should continue throughout 2021. The ability to operate at 95% utilization, which means no downtime, is indicative of an undersupply situation.
OLED mobile fab utilization has become a function of:
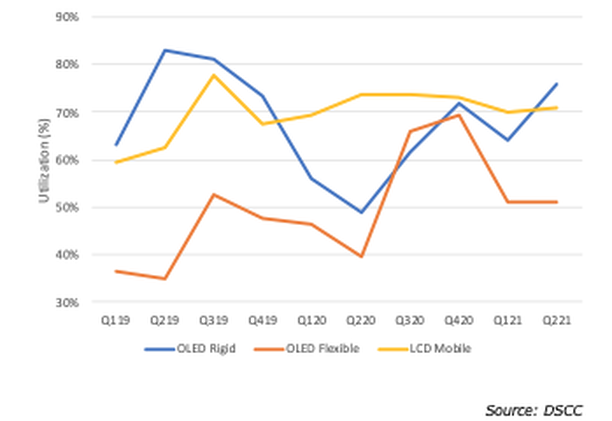
As a result, flexible OLED utilization reached the upper 60% in Q320 and Q420 but dropped down to 50% in !h21; rigid OLED utilization has been on a steady climb from 50% in Q220 to 76% in Q221 and LTPS LCDs remain relatively constant at 70% even as their market share drops.
Figure 2: Mobile Fab Utilization LCD vs. OLED
OLED mobile fab utilization has become a function of:
- Apple’s flexible iPhone production, which is heavily weighted to the introduction of new phones in Q3 and Q4
- The low yields of Chinese fabs, which causes low utilization.
- The reduction in rigid panel prices and the recent improvement in Chinese fab yields that has prompted Chinese smartphone to begin switching from LTPS LCDs to rigid OLEDs in mid-range phones in addition to the increase in OLED tablet and notebook panel demand.
As a result, flexible OLED utilization reached the upper 60% in Q320 and Q420 but dropped down to 50% in !h21; rigid OLED utilization has been on a steady climb from 50% in Q220 to 76% in Q221 and LTPS LCDs remain relatively constant at 70% even as their market share drops.
Figure 2: Mobile Fab Utilization LCD vs. OLED
|
Contact Us
|
Barry Young
|


