|
Samsung’s OLEDs Over 60% of Total Display Revenue
August 06, 2017 DSSC reports that in Samsung’s Q217 quarter OLED revenue share grew over LCD’s as shown in the following chart. While OLED revenue gained share up 2% Y/Y and Q/Q, LCD revenue share dropped by a similar amount. The trends are also working in favor of OLEDs as OLED pricing for flexible displays remained high US$70-US$80, while the trend in TVs, where Samsung gets most of its LCD revenue is down and prices seem to have peaked. Note: Samsung Display does not release most financial info, so DSSC must gather the data from their own sources. Figure 1 Samsung Display’s Revenue Share by Technology 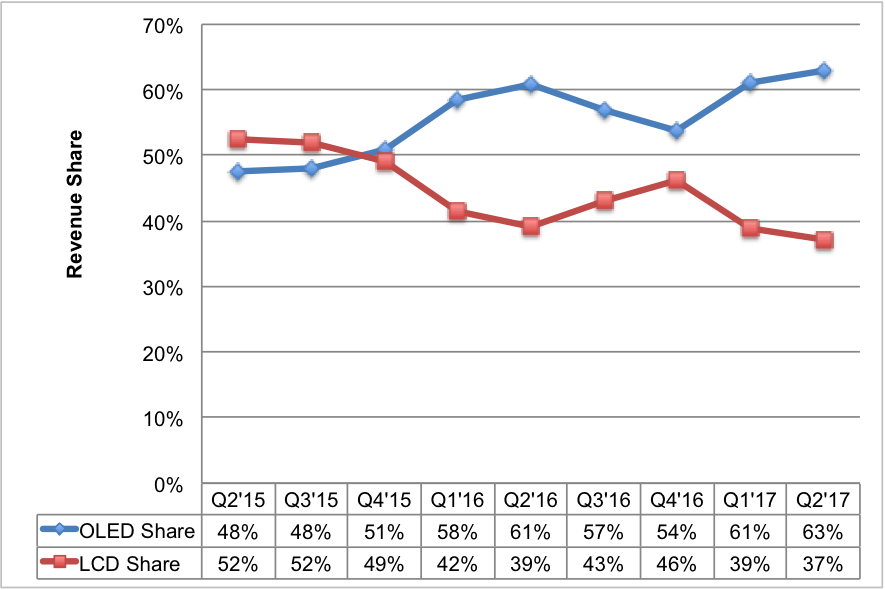
Source: Display Supply Chain Consultants (DSCC)
In terms of operating margin in Q217, DSSC shows that LCDs caught up to OLEDs at 21.7% compared to OLED’s 22.5%. The outlook for OLEDs is more promising than LCDs as TV prices are expected to fall and Samsung is reducing their sales forecasts and just made announced a significant price reduction in QLED TVs. (See out TV section for details). Figure 2 Samsung Display’s Operating Margin by Technology 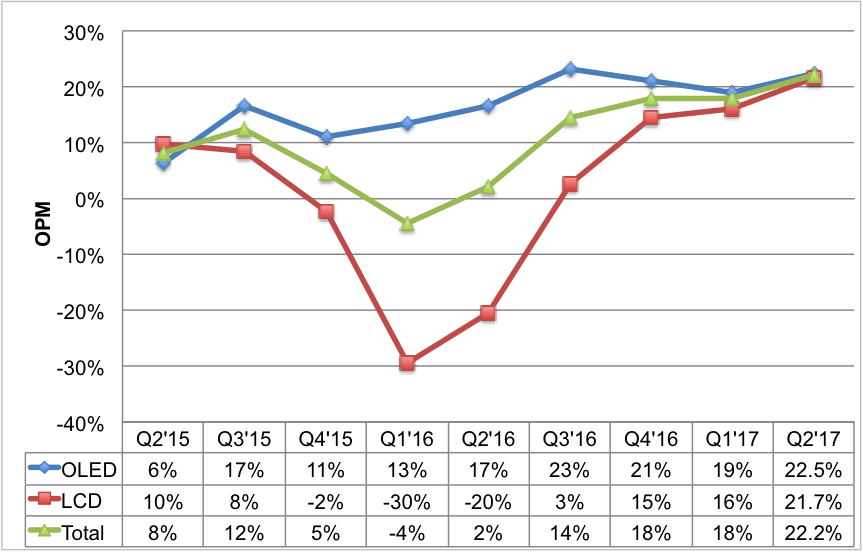
Source: DSCC
|
Vertical Divider
|
Search by typing & pressing enter